Baker Hughes 2013 Annual Report Download - page 7
Download and view the complete annual report
Please find page 7 of the 2013 Baker Hughes annual report below. You can navigate through the pages in the report by either clicking on the pages listed below, or by using the keyword search tool below to find specific information within the annual report.-
 1
1 -
 2
2 -
 3
3 -
 4
4 -
 5
5 -
 6
6 -
 7
7 -
 8
8 -
 9
9 -
 10
10 -
 11
11 -
 12
12 -
 13
13 -
 14
14 -
 15
15 -
 16
16 -
 17
17 -
 18
18 -
19
-
20
-
21
-
22
-
23
-
24
-
25
-
26
-
27
-
28
-
29
-
30
-
31
-
32
-
33
-
34
-
35
-
36
-
37
-
38
-
39
-
40
-
41
-
42
-
43
-
44
-
45
-
46
-
47
-
48
-
49
-
50
-
51
-
52
-
53
-
54
-
55
-
56
-
57
-
58
-
59
-
60
-
61
-
62
-
63
-
64
-
65
-
66
-
67
-
68
-
69
-
70
-
71
-
72
-
73
-
74
-
75
-
76
-
77
-
78
-
79
-
80
-
81
-
82
-
83
-
84
-
85
-
86
-
87
-
88
-
89
-
90
-
91
-
92
-
93
-
94
-
95
-
96
-
97
-
98
-
99
-
100
-
101
-
102
-
103
-
104
-
105
-
106
-
107
-
108
-
109
-
110
-
111
-
112
-
113
-
114
-
115
-
116
-
117
-
118
-
119
-
120
-
121
 |
 |

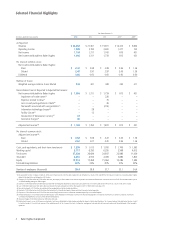
Selected Financial Highlights
Year Ended December 31
(In millions, except per share amounts) 2013 2012 2011 2010(1) 2009(1)
As Reported:
Revenue $ 22,364 $ 21,361 $ 19,831 $ 14,414 $ 9,664
Operating income 1,949 2,192 2,600 1,417 732
Net income 1,103 1,317 1,743 819 421
Net income attributable to Baker Hughes 1,096 1,311 1,739 812 421
Per share of common stock:
Net income attributable to Baker Hughes:
Basic $ 2.47 $ 2.98 $ 3.99 $ 2.06 $ 1.36
Diluted 2.47 2.97 3.97 2.06 1.36
Dividends 0.60 0.60 0.60 0.60 0.60
Number of shares:
Weighted average common shares diluted 444 441 438 395 311
Reconciliation from As Reported to Adjusted Net Income:
Net income attributable to Baker Hughes $ 1,096 $ 1,311 $ 1,739 $ 812 $ 421
Impairment of trade names(2) – – 220 – –
Expenses related to Libya(3) – – 70 – –
Loss on early extinguishment of debt(4) – – 26 – –
Tax benefi t associated with reorganization(5) – – (214) – –
Information technology charges(6)
– 28 – – –
Facility closure(7)
– 15 – – –
Devaluation of Venezuelan currency(8)
23 – – – –
Severance charges(9)
46 – – – –
Adjusted net income(10) $ 1,165 $ 1,354 $ 1,841 $ 812 $ 421
Per share of common stock:
Adjusted net income(10):
Basic $ 2.62 $ 3.08 $ 4.22 $ 2.06 $ 1.36
Diluted 2.62 3.07 4.20 2.06 1.36
Cash, cash equivalents, and short-term investments $ 1,399 $ 1,015 $ 1,050 $ 1,706 $ 1,595
Working capital 6,717 6,293 6,295 5,568 4,612
Total assets 27,934 26,689 24,847 22,986 11,439
Total debt 4,381 4,916 4,069 3,885 1,800
Equity 17,912 17,268 15,964 14,286 7,284
Total debt/capitalization 20% 22% 20% 21% 20%
Number of employees (thousands) 59.4 58.8 57.7 53.1 34.4
(1) We acquired BJ Services Company on April 28, 2010, and its fi nancial results from the date of acquisition are included in our results. 2010 and 2009 net income also include costs incurred by Baker Hughes
related to the acquisition and integration of BJ Services.
(2) Charge of $315 million before-tax ($220 million after-tax), the majority of which relates to the noncash impairment associated with the decision to minimize the use of the BJ Services trade name as part of
our overall branding strategy for Baker Hughes.
(3) Expenses of $70 million (before and after-tax) associated with increasing the allowance for doubtful accounts, and reserves for inventory and certain other assets as a result of civil unrest in Libya.
(4) Loss of $40 million before-tax ($26 million after-tax) related to the early extinguishment in the third quarter of 2011 of $500 million notes due 2013.
(5) Noncash tax benefi t of $214 million associated with the reorganization of certain foreign subsidiaries.
(6) Expenses of $43 million before-tax ($28 million after-tax) related to internally developed software and other information technology assets.
(7) Expenses of $20 million before-tax ($15 million after-tax) resulting from the closure of a chemical manufacturing facility in the United Kingdom.
(8) Foreign exchange loss of $23 million before and after-tax due to the devaluation of Venezuela’s currency from the prior exchange rate of 4.3 Bolivars Fuertes per U.S. Dollar to 6.3 Bolivars Fuertes per
U.S. Dollar, which applied to our local currency denominated balances.
(9) Severance charges of $56 million before-tax ($46 million after-tax).
(10) Adjusted net income is a non-GAAP measure comprised of net income attributable to Baker Hughes excluding the impact of certain identifi ed items. The Company believes that adjusted net income is useful
to investors because it is a consistent measure of the underlying results of the Company’s business. Furthermore, management uses adjusted net income as a measure of the performance of the Company’s
operations.
2 Baker Hughes Incorporated