Baker Hughes 2013 Annual Report Download - page 4
Download and view the complete annual report
Please find page 4 of the 2013 Baker Hughes annual report below. You can navigate through the pages in the report by either clicking on the pages listed below, or by using the keyword search tool below to find specific information within the annual report.-
 1
1 -
 2
2 -
 3
3 -
 4
4 -
 5
5 -
 6
6 -
 7
7 -
 8
8 -
 9
9 -
 10
10 -
 11
11 -
 12
12 -
 13
13 -
 14
14 -
 15
15 -
16
-
17
-
18
-
19
-
20
-
21
-
22
-
23
-
24
-
25
-
26
-
27
-
28
-
29
-
30
-
31
-
32
-
33
-
34
-
35
-
36
-
37
-
38
-
39
-
40
-
41
-
42
-
43
-
44
-
45
-
46
-
47
-
48
-
49
-
50
-
51
-
52
-
53
-
54
-
55
-
56
-
57
-
58
-
59
-
60
-
61
-
62
-
63
-
64
-
65
-
66
-
67
-
68
-
69
-
70
-
71
-
72
-
73
-
74
-
75
-
76
-
77
-
78
-
79
-
80
-
81
-
82
-
83
-
84
-
85
-
86
-
87
-
88
-
89
-
90
-
91
-
92
-
93
-
94
-
95
-
96
-
97
-
98
-
99
-
100
-
101
-
102
-
103
-
104
-
105
-
106
-
107
-
108
-
109
-
110
-
111
-
112
-
113
-
114
-
115
-
116
-
117
-
118
-
119
-
120
-
121
 |
 |

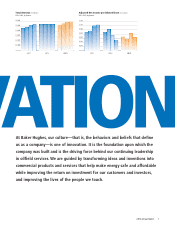
Total Revenue (in Millions)
2011–2013, by Quarter
Adjusted Net Income per Diluted Share (non-GAAP)
2011–2013, by Quarter
201320122011
$6,000
$5,000
$4,000
$3,000
$2,000
$1,000
$1.40
$1.20
$1.00
$0.80
$0.60
$0.40
$0.20
201320122011
At Baker Hughes, our culture—that is, the behaviors and beliefs that defi ne
us as a company—is one of innovation. It is the foundation upon which the
company was built and is the driving force behind our continuing leadership
in oilfi eld services. We are guided by transforming ideas and inventions into
commercial products and services that help make energy safe and affordable
while improving the return on investment for our customers and investors,
and improving the lives of the people we touch.
2013 Annual Report 1