BP 2011 Annual Report Download - page 93
Download and view the complete annual report
Please find page 93 of the 2011 BP annual report below. You can navigate through the pages in the report by either clicking on the pages listed below, or by using the keyword search tool below to find specific information within the annual report.-
 1
1 -
2
-
3
-
4
-
5
-
6
-
7
-
8
-
9
-
10
-
11
-
12
-
13
-
14
-
15
-
16
-
17
-
18
-
19
-
20
-
21
-
22
-
23
-
24
-
25
-
26
-
27
-
28
-
29
-
30
-
31
-
32
-
33
-
34
-
35
-
36
-
37
-
38
-
39
-
40
-
41
-
42
-
43
-
44
-
45
-
46
-
47
-
48
-
49
-
50
-
51
-
52
-
53
-
54
-
55
-
56
-
57
-
58
-
59
-
60
-
61
-
62
-
63
-
64
-
65
-
66
-
67
-
68
-
69
-
70
-
71
-
72
-
73
-
74
-
75
-
76
-
77
-
78
-
79
-
80
-
81
-
82
-
 83
83 -
 84
84 -
 85
85 -
 86
86 -
 87
87 -
 88
88 -
 89
89 -
 90
90 -
 91
91 -
 92
92 -
 93
93 -
 94
94 -
 95
95 -
 96
96 -
 97
97 -
 98
98 -
 99
99 -
 100
100 -
 101
101 -
 102
102 -
 103
103 -
104
-
105
-
106
-
107
-
108
-
109
-
110
-
111
-
112
-
113
-
114
-
115
-
116
-
117
-
118
-
119
-
120
-
121
-
122
-
123
-
124
-
125
-
126
-
127
-
128
-
129
-
130
-
131
-
132
-
133
-
134
-
135
-
136
-
137
-
138
-
139
-
140
-
141
-
142
-
143
-
144
-
145
-
146
-
147
-
148
-
149
-
150
-
151
-
152
-
153
-
154
-
155
-
156
-
157
-
158
-
159
-
160
-
161
-
162
-
163
-
164
-
165
-
166
-
167
-
168
-
169
-
170
-
171
-
172
-
173
-
174
-
175
-
176
-
177
-
178
-
179
-
180
-
181
-
182
-
183
-
184
-
185
-
186
-
187
-
188
-
189
-
190
-
191
-
192
-
193
-
194
-
195
-
196
-
197
-
198
-
199
-
200
-
201
-
202
-
203
-
204
-
205
-
206
-
207
-
208
-
209
-
210
-
211
-
212
-
213
-
214
-
215
-
216
-
217
-
218
-
219
-
220
-
221
-
222
-
223
-
224
-
225
-
226
-
227
-
228
-
229
-
230
-
231
-
232
-
233
-
234
-
235
-
236
-
237
-
238
-
239
-
240
-
241
-
242
-
243
-
244
-
245
-
246
-
247
-
248
-
249
-
250
-
251
-
252
-
253
-
254
-
255
-
256
-
257
-
258
-
259
-
260
-
261
-
262
-
263
-
264
-
265
-
266
-
267
-
268
-
269
-
270
-
271
-
272
-
273
-
274
-
275
-
276
-
277
-
278
-
279
-
280
-
281
-
282
-
283
-
284
-
285
-
286
-
287
-
288
-
289
-
290
-
291
-
292
-
293
-
294
-
295
-
296
-
297
-
298
-
299
-
300
 |
 |

BP Annual Report and Form 20-F 2011 91
Business review: BP in more depth
Business review
BP’s vice president of segment reserves is the petroleum engineer
primarily responsible for overseeing the preparation of the reserves
estimate. He has over 25 years of diversified industry experience with
the past eight spent managing the governance and compliance of BP’s
reserves estimation. He is a past member of the Society of Petroleum
Engineers Oil and Gas Reserves Committee, a sitting member of the
American Association of Petroleum Geologists Committee on Resource
Evaluation and vice chair of the bureau of the United Nations Economic
Commission for Europe Expert Group on Resource Classification.
For the executive directors and senior management, no specific
portion of compensation bonuses is directly related to proved reserves
targets. Additions to proved reserves is one of several indicators by
which the performance of the Exploration and Production segment is
assessed by the remuneration committee for the purposes of determining
compensation bonuses for the executive directors. Other indicators include
a number of financial and operational measures.
BP’s variable pay programme for the other senior managers in the
Exploration and Production segment is based on individual performance
contracts. Individual performance contracts are based on agreed items
from the business performance plan, one of which, if chosen, could relate
to proved reserves.
Compliance
International Financial Reporting Standards (IFRSs) do not provide
specific guidance on reserves disclosures. BP estimates proved reserves
in accordance with SEC Rule 4-10 (a) of Regulation S-X and relevant
Compliance and Disclosure Interpretations (C&DI) and Staff Accounting
Bulletins as issued by the SEC staff.
By their nature, there is always some risk involved in the ultimate
development and production of proved reserves, including, but not
limited to, final regulatory approval, the installation of new or additional
infrastructure, as well as changes in oil and gas prices, changes in
operating and development costs and the continued availability of additional
development capital. All the group’s proved reserves held in subsidiaries
and equity-accounted entities are estimated by the group’s petroleum
engineers.
Our proved reserves are associated with both concessions (tax
and royalty arrangements) and agreements where the group is exposed to
the upstream risks and rewards of ownership, but where our entitlement
to the hydrocarbons is calculated using a more complex formula, such as
PSAs. In a concession, the consortium of which we are a part is entitled to
the proved reserves that can be produced over the licence period, which
may be the life of the field. In a PSA, we are entitled to recover volumes
that equate to costs incurred to develop and produce the proved reserves
and an agreed share of the remaining volumes or the economic equivalent.
As part of our entitlement is driven by the monetary amount of costs to
be recovered, price fluctuations will have an impact on both production
volumes and reserves.
We disclose our share of proved reserves held in equity-accounted
entities (jointly controlled entities and associates), although we do not
control these entities or the assets held by such entities.
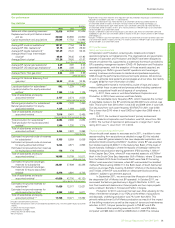
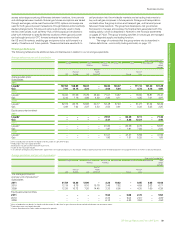
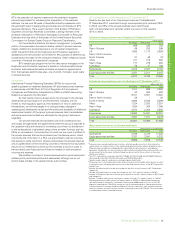
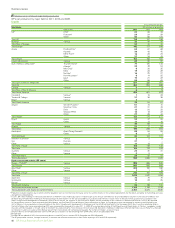
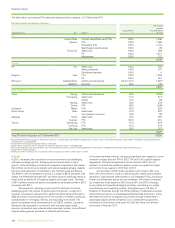
BP’s estimated net proved reserves as at 31 December 2011
Seventy-five per cent of our total proved reserves of subsidiaries at
31 December 2011 were held through unincorporated joint ventures (75%
in 2010), and 33% of the proved reserves were held through
such unincorporated joint ventures where we were not the operator
(31% in 2010).
Estimated net proved reserves of liquids at 31 December 2011a b c
million barrels
Developed Undeveloped Total
UK 288 445 733
Rest of Europe 69 230 299
US 1,685 1,173 2,858d
Rest of North America –––
South America 27 48 75e
Africa 311 315 626
Rest of Asia 177 279 456
Australasia 59 47 106
Subsidiaries 2,616 2,537 5,153
Equity-accounted entities 3,201 2,211 5,412f
Total 5,817 4,748 10,565
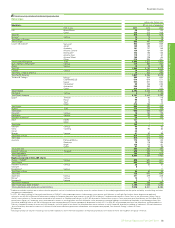
Estimated net proved reserves of natural gas at 31 December 2011a b
billion cubic feet
Developed Undeveloped Total
UK 1,411 909 2,320
Rest of Europe 43 450 493
US 9,721 3,831 13,552
Rest of North America 28 –28
South America 2,869 6,529 9,398g
Africa 1,224 2,033 3,257
Rest of Asia 1,034 364 1,398
Australasia 3,570 2,365 5,935
Subsidiaries 19,900 16,481 36,381
Equity-accounted entities 3,367 1,911 5,278h
Total 23,267 18,392 41,659
Net proved reserves on an oil equivalent basis
million barrels of oil equivalent
Developed Undeveloped Total
Subsidiaries 6,048 5,378 11,426
Equity-accounted entities 3,781 2,541 6,322i
Total 9,829 7,919 17,748
a Proved reserves exclude royalties due to others, whether payable in cash or in kind, where the
royalty owner has a direct interest in the underlying production and the option and ability to make
lifting and sales arrangements independently, and include minority interests in consolidated
operations. We disclose our share of reserves held in jointly controlled entities and associates that
are accounted for by the equity method although we do not control these entities or the assets
held by such entities.
b The 2011 marker prices used were Brent $110.96/bbl (2010 $79.02/bbl and 2009 $59.91/bbl) and
Henry Hub $4.12/mmBtu (2010 $4.37/mmBtu and 2009 $3.82/mmBtu).
c Liquids include crude oil, condensate, natural gas liquids and bitumen.
d Proved reserves in the Prudhoe Bay field in Alaska include an estimated 82 million barrels on which
a net profits royalty will be payable over the life of the field under the terms of the BP Prudhoe Bay
Royalty Trust.
e Includes 20 million barrels of crude oil in respect of the 30% minority interest in BP Trinidad and
Tobago LLC.
f Includes 310 million barrels of crude oil in respect of the 7.37% minority interest in TNK-BP.
g Includes 2,759 billion cubic feet of natural gas in respect of the 30% minority interest in BP Trinidad
and Tobago LLC.
h Includes 174 billion cubic feet of natural gas in respect of the 6.27% minority interest in TNK-BP.
i Total proved reserves held as part of our equity interest in TNK-BP is 4,802mmboe comprising
100 million barrels in Venezuela, 14mmboe in Vietnam and 4,688mmboe in Russia. In 2011 BP
aligned its reporting with TNK-BP by moving to a life of field reporting basis. Reasonable certainty
of licence renewals is demonstrated by evidence of Russian subsoil law, track record of renewals
within the industry and track record of success in obtaining renewals by TNK-BP. This has resulted
in a 253mmboe increase in proved reserves.