BP 2011 Annual Report Download - page 217
Download and view the complete annual report
Please find page 217 of the 2011 BP annual report below. You can navigate through the pages in the report by either clicking on the pages listed below, or by using the keyword search tool below to find specific information within the annual report.-
 1
1 -
2
-
3
-
4
-
5
-
6
-
7
-
8
-
9
-
10
-
11
-
12
-
13
-
14
-
15
-
16
-
17
-
18
-
19
-
20
-
21
-
22
-
23
-
24
-
25
-
26
-
27
-
28
-
29
-
30
-
31
-
32
-
33
-
34
-
35
-
36
-
37
-
38
-
39
-
40
-
41
-
42
-
43
-
44
-
45
-
46
-
47
-
48
-
49
-
50
-
51
-
52
-
53
-
54
-
55
-
56
-
57
-
58
-
59
-
60
-
61
-
62
-
63
-
64
-
65
-
66
-
67
-
68
-
69
-
70
-
71
-
72
-
73
-
74
-
75
-
76
-
77
-
78
-
79
-
80
-
81
-
82
-
83
-
84
-
85
-
86
-
87
-
88
-
89
-
90
-
91
-
92
-
93
-
94
-
95
-
96
-
97
-
98
-
99
-
100
-
101
-
102
-
103
-
104
-
105
-
106
-
107
-
108
-
109
-
110
-
111
-
112
-
113
-
114
-
115
-
116
-
117
-
118
-
119
-
120
-
121
-
122
-
123
-
124
-
125
-
126
-
127
-
128
-
129
-
130
-
131
-
132
-
133
-
134
-
135
-
136
-
137
-
138
-
139
-
140
-
141
-
142
-
143
-
144
-
145
-
146
-
147
-
148
-
149
-
150
-
151
-
152
-
153
-
154
-
155
-
156
-
157
-
158
-
159
-
160
-
161
-
162
-
163
-
164
-
165
-
166
-
167
-
168
-
169
-
170
-
171
-
172
-
173
-
174
-
175
-
176
-
177
-
178
-
179
-
180
-
181
-
182
-
183
-
184
-
185
-
186
-
187
-
188
-
189
-
190
-
191
-
192
-
193
-
194
-
195
-
196
-
197
-
198
-
199
-
200
-
201
-
202
-
203
-
204
-
205
-
206
-
 207
207 -
 208
208 -
 209
209 -
 210
210 -
 211
211 -
 212
212 -
 213
213 -
 214
214 -
 215
215 -
 216
216 -
 217
217 -
 218
218 -
 219
219 -
 220
220 -
 221
221 -
 222
222 -
 223
223 -
 224
224 -
 225
225 -
 226
226 -
 227
227 -
228
-
229
-
230
-
231
-
232
-
233
-
234
-
235
-
236
-
237
-
238
-
239
-
240
-
241
-
242
-
243
-
244
-
245
-
246
-
247
-
248
-
249
-
250
-
251
-
252
-
253
-
254
-
255
-
256
-
257
-
258
-
259
-
260
-
261
-
262
-
263
-
264
-
265
-
266
-
267
-
268
-
269
-
270
-
271
-
272
-
273
-
274
-
275
-
276
-
277
-
278
-
279
-
280
-
281
-
282
-
283
-
284
-
285
-
286
-
287
-
288
-
289
-
290
-
291
-
292
-
293
-
294
-
295
-
296
-
297
-
298
-
299
-
300
 |
 |

Financial statements
BP Annual Report and Form 20-F 2011 215
Notes on financial statements
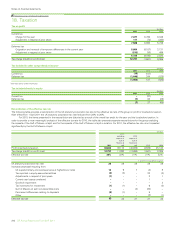
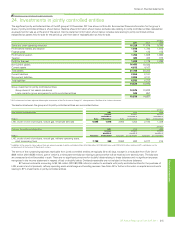
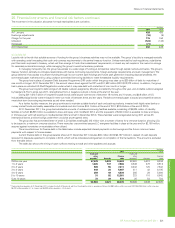
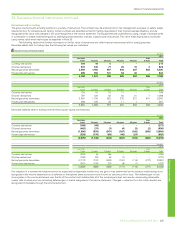
24. Investments in jointly controlled entities
The significant jointly controlled entities of the BP group at 31 December 2011 are shown in Note 45. Summarized financial information for the group’s
share of jointly controlled entities is shown below. Balance sheet information shown below excludes data relating to jointly controlled entities reclassified
as assets held for sale as at the end of the period. Income statement information shown below includes data relating to jointly controlled entities
reclassified as assets held for sale for the period up until their date of reclassification as held for sale.
$ million
2011 2010a2009
Sales and other operating revenues 15,720 11,679 9,396
Profit before interest and taxation 1,918 1,730 1,815
Finance costs 134 122 155
Profit before taxation 1,784 1,608 1,660
Taxation 480 433 374
Profit for the year 1,304 1,175 1,286
Non-current assets 16,495 16,035
Current assets 4,613 4,167
Total assets 21,108 20,202
Current liabilities 2,553 2,101
Non-current liabilities 3,980 4,131
Total liabilities 6,533 6,232
14,575 13,970
Group investment in jointly controlled entities
Group share of net assets (as above) 14,575 13,970
Loans made by group companies to jointly controlled entities 943 957
15,518 14,927
a 2010 information has been adjusted following the termination of the Pan American Energy LLC sale agreement. See Note 4 for further information.
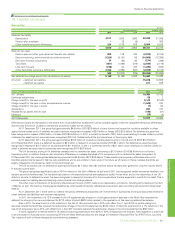
Transactions between the group and its jointly controlled entities are summarized below.
$ million
Sales to jointly controlled entities 2011 2010 2009
Product Sales
Amount
receivable at
31 December Sales
Amount
receivable at
31 December Sales
Amount
receivable at
31 December
LNG, crude oil and oil products, natural gas, employee services 5,095 1,616 3,804 1,352 2,182 1,328
$ million
Purchases from jointly controlled entities 2011 2010 2009
Product Purchases
Amount
payable at
31 DecemberaPurchases
Amount
payable at
31 DecemberaPurchases
Amount
payable at
31 Decembera
LNG, crude oil and oil products, natural gas, refinery operating costs,
plant processing fees 7,798 369 8,063 683 5,377 214
a In addition to the amounts shown above, there are amounts payable to jointly controlled entities of $2,256 million (2010 $2,583 million and 2009 $2,509 million) relating to BP’s contribution on the
establishment of the Sunrise Oil Sands joint venture.
The terms of the outstanding balances receivable from jointly controlled entities are typically 30 to 45 days, except for a receivable from Ruhr Oel of
$605 million (2010 $585 million), part of which is a reimbursement balance relating to pensions that will be received over several years. The balances
are unsecured and will be settled in cash. There are no significant provisions for doubtful debts relating to these balances and no significant expense
recognized in the income statement in respect of bad or doubtful debts. Dividends receivable are not included in the above balances.
BP has commitments amounting to $4,155 million (2010 $3,389 million) in relation to contracts with jointly controlled entities for the purchase of
LNG, crude oil and oil products, refinery operating costs and storage and handling services. See Note 44 for further information on capital commitments
relating to BP’s investments in jointly controlled entities.
http://www.bp.com/downloads/investments