BP 2011 Annual Report Download - page 157
Download and view the complete annual report
Please find page 157 of the 2011 BP annual report below. You can navigate through the pages in the report by either clicking on the pages listed below, or by using the keyword search tool below to find specific information within the annual report.-
 1
1 -
2
-
3
-
4
-
5
-
6
-
7
-
8
-
9
-
10
-
11
-
12
-
13
-
14
-
15
-
16
-
17
-
18
-
19
-
20
-
21
-
22
-
23
-
24
-
25
-
26
-
27
-
28
-
29
-
30
-
31
-
32
-
33
-
34
-
35
-
36
-
37
-
38
-
39
-
40
-
41
-
42
-
43
-
44
-
45
-
46
-
47
-
48
-
49
-
50
-
51
-
52
-
53
-
54
-
55
-
56
-
57
-
58
-
59
-
60
-
61
-
62
-
63
-
64
-
65
-
66
-
67
-
68
-
69
-
70
-
71
-
72
-
73
-
74
-
75
-
76
-
77
-
78
-
79
-
80
-
81
-
82
-
83
-
84
-
85
-
86
-
87
-
88
-
89
-
90
-
91
-
92
-
93
-
94
-
95
-
96
-
97
-
98
-
99
-
100
-
101
-
102
-
103
-
104
-
105
-
106
-
107
-
108
-
109
-
110
-
111
-
112
-
113
-
114
-
115
-
116
-
117
-
118
-
119
-
120
-
121
-
122
-
123
-
124
-
125
-
126
-
127
-
128
-
129
-
130
-
131
-
132
-
133
-
134
-
135
-
136
-
137
-
138
-
139
-
140
-
141
-
142
-
143
-
144
-
145
-
146
-
 147
147 -
 148
148 -
 149
149 -
 150
150 -
 151
151 -
 152
152 -
 153
153 -
 154
154 -
 155
155 -
 156
156 -
 157
157 -
 158
158 -
 159
159 -
 160
160 -
 161
161 -
 162
162 -
 163
163 -
 164
164 -
 165
165 -
 166
166 -
 167
167 -
168
-
169
-
170
-
171
-
172
-
173
-
174
-
175
-
176
-
177
-
178
-
179
-
180
-
181
-
182
-
183
-
184
-
185
-
186
-
187
-
188
-
189
-
190
-
191
-
192
-
193
-
194
-
195
-
196
-
197
-
198
-
199
-
200
-
201
-
202
-
203
-
204
-
205
-
206
-
207
-
208
-
209
-
210
-
211
-
212
-
213
-
214
-
215
-
216
-
217
-
218
-
219
-
220
-
221
-
222
-
223
-
224
-
225
-
226
-
227
-
228
-
229
-
230
-
231
-
232
-
233
-
234
-
235
-
236
-
237
-
238
-
239
-
240
-
241
-
242
-
243
-
244
-
245
-
246
-
247
-
248
-
249
-
250
-
251
-
252
-
253
-
254
-
255
-
256
-
257
-
258
-
259
-
260
-
261
-
262
-
263
-
264
-
265
-
266
-
267
-
268
-
269
-
270
-
271
-
272
-
273
-
274
-
275
-
276
-
277
-
278
-
279
-
280
-
281
-
282
-
283
-
284
-
285
-
286
-
287
-
288
-
289
-
290
-
291
-
292
-
293
-
294
-
295
-
296
-
297
-
298
-
299
-
300
 |
 |

Additional information for shareholders
BP Annual Report and Form 20-F 2011 155
Additional information for shareholders
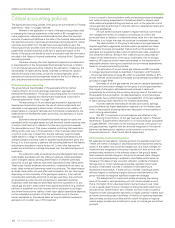
For oil and natural gas properties, the expected future cash flows are
estimated using management’s best estimate of future oil and natural
gas prices and reserves volumes. Prices for oil and natural gas used for
future cash flow calculations are based on market prices for the first
five years and the group’s long-term price assumptions thereafter. As at
31 December 2011, the group’s long-term price assumptions were $90
per barrel for Brent and $6.50/mmBtu for Henry Hub (2010 $75 per barrel
and $6.50/mmBtu). These long-term price assumptions are subject to
periodic review and modification. The estimated future level of production
is based on assumptions about future commodity prices, production
and development costs, field decline rates, current fiscal regimes and
other factors.
The future cash flows are adjusted for risks specific to the cash-
generating unit and are discounted using a pre-tax discount rate. The
discount rate is derived from the group’s post-tax weighted average
cost of capital and is adjusted where applicable to take into account any
specific risks relating to the country where the cash-generating unit is
located, although other rates may be used if appropriate to the specific
circumstances. In 2011 the rates ranged from 12% to 14% nominal
(2010 11% to 14% nominal). The rate applied in each country is
reassessed each year.
Irrespective of whether there is any indication of impairment, BP is
required to test annually for impairment of goodwill acquired in a business
combination. The group carries goodwill of approximately $12.1 billion
on its balance sheet (2010 $8.6 billion), principally relating to the Atlantic
Richfield, Burmah Castrol, Devon Energy and Reliance transactions. In
testing goodwill for impairment, the group uses a similar approach to that
described above for asset impairment. If there are low oil prices or natural
gas prices or refining margins or marketing margins for an extended period,
the group may need to recognize significant goodwill impairment charges.
In 2009, an impairment loss of $1.6 billion was recognized to write off all
of the goodwill allocated to the US West Coast fuels value chain (FVC).
The prevailing weak refining environment, together with a review of future
margin expectations in the FVC, led to a reduction in the expected future
cash flows.
Refer to Oil and natural gas accounting above for a discussion on
the recoverability of intangible exploration and appraisal expenditure.
Details of impairment charges recognized in the income statement
are provided in Financial statements – Note 5 and details on the carrying
amounts of assets are shown in Financial statements – Note 21, Note 22
and Note 23.
Business combinations
Accounting for business combinations using the acquisition method
requires the determination of the fair value of the consideration transferred,
together with the fair value of the identifiable assets acquired and liabilities
assumed at the acquisition date. Goodwill is measured as being the excess
of the aggregate of the consideration transferred, the amount recognized
for any minority interest and the acquisition-date fair values of any
previously held interest in the acquiree over the fair value of the identifiable
assets acquired and liabilities assumed at the acquisition date.
Judgement is required in determining whether a transaction meets
the criteria to be treated as a business combination or not. Judgements
and estimates are also required in order to determine the fair values of the
assets acquired and the liabilities assumed, and the group uses all available
information, including external valuations and appraisals where appropriate,
to determine these fair values. If necessary, the group has up to one year
from the acquisition date to finalize the determinations of fair value.
Details of the business combinations undertaken by the group in
2011 are provided in Financial statements – Note 3 on page 194.
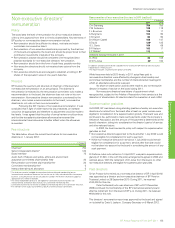
Taxation
The computation of the group’s income tax expense and liability
involves the interpretation of applicable tax laws and regulations in many
jurisdictions throughout the world. The resolution of tax positions taken
by the group, through negotiations with relevant tax authorities or through
litigation, can take several years to complete and in some cases it is
difficult to predict the ultimate outcome.
In addition, the group has carry-forward tax losses and tax credits in
certain taxing jurisdictions that are available to offset against future taxable
profit. However, deferred tax assets are recognized only to the extent
that it is probable that taxable profit will be available against which the
unused tax losses or tax credits can be utilized. Management judgement is
exercised in assessing whether this is the case.
To the extent that actual outcomes differ from management’s
estimates, income tax charges or credits, and changes in deferred tax
assets or liabilities, may arise in future periods. For more information see
Financial statements – Note 18 on page 210 and Note 43 on page 249.
Derivative financial instruments
The group uses derivative financial instruments to manage certain
exposures to fluctuations in foreign currency exchange rates, interest
rates and commodity prices as well as for trading purposes. In addition,
derivatives embedded within other financial instruments or other host
contracts are treated as separate derivatives when their risks and
characteristics are not closely related to those of the host contract. All
such derivatives are initially recognized at fair value on the date on which a
derivative contract is entered into and are subsequently remeasured at fair
value. Gains and losses arising from changes in the fair value of derivatives
that are not designated as effective hedging instruments are recognized in
the income statement.
In some cases the fair values of derivatives are estimated using
internal models and other valuation methods due to the absence of quoted
prices or other observable, market-corroborated data. This applies to the
group’s longer-term, structured derivative products and complex options,
as well as to the majority of the group’s natural gas embedded derivatives.
The group’s embedded derivatives arise primarily from long-term UK gas
contracts that use pricing formulae not related to gas prices, for example,
oil product and power prices. These contracts are valued using models
with inputs that include price curves for each of the different products that
are built up from active market pricing data and extrapolated to the expiry
of the contracts using the maximum available external pricing information.
Additionally, where limited data exists for certain products, prices are
interpolated using historic and long-term pricing relationships. Price
volatility is also an input for the models.
Changes in the key assumptions could have a material impact on
the fair value gains and losses on derivatives and embedded derivatives
recognized in the income statement. For more information see Financial
statements – Note 33 on page 224.
Details of the value-at-risk techniques used by the group to
measure market risk exposure arising from its derivative trading positions
is provided in Financial statements – Note 26 on page 217. An analysis of
the sensitivity of the fair value of the embedded derivatives to changes
in the key assumptions is provided in Financial statements – Note 26 on
page 217.