BP 2011 Annual Report Download - page 151
Download and view the complete annual report
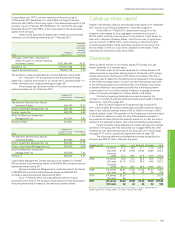
Please find page 151 of the 2011 BP annual report below. You can navigate through the pages in the report by either clicking on the pages listed below, or by using the keyword search tool below to find specific information within the annual report.-
 1
1 -
2
-
3
-
4
-
5
-
6
-
7
-
8
-
9
-
10
-
11
-
12
-
13
-
14
-
15
-
16
-
17
-
18
-
19
-
20
-
21
-
22
-
23
-
24
-
25
-
26
-
27
-
28
-
29
-
30
-
31
-
32
-
33
-
34
-
35
-
36
-
37
-
38
-
39
-
40
-
41
-
42
-
43
-
44
-
45
-
46
-
47
-
48
-
49
-
50
-
51
-
52
-
53
-
54
-
55
-
56
-
57
-
58
-
59
-
60
-
61
-
62
-
63
-
64
-
65
-
66
-
67
-
68
-
69
-
70
-
71
-
72
-
73
-
74
-
75
-
76
-
77
-
78
-
79
-
80
-
81
-
82
-
83
-
84
-
85
-
86
-
87
-
88
-
89
-
90
-
91
-
92
-
93
-
94
-
95
-
96
-
97
-
98
-
99
-
100
-
101
-
102
-
103
-
104
-
105
-
106
-
107
-
108
-
109
-
110
-
111
-
112
-
113
-
114
-
115
-
116
-
117
-
118
-
119
-
120
-
121
-
122
-
123
-
124
-
125
-
126
-
127
-
128
-
129
-
130
-
131
-
132
-
133
-
134
-
135
-
136
-
137
-
138
-
139
-
140
-
 141
141 -
 142
142 -
 143
143 -
 144
144 -
 145
145 -
 146
146 -
 147
147 -
 148
148 -
 149
149 -
 150
150 -
 151
151 -
 152
152 -
 153
153 -
 154
154 -
 155
155 -
 156
156 -
 157
157 -
 158
158 -
 159
159 -
 160
160 -
 161
161 -
162
-
163
-
164
-
165
-
166
-
167
-
168
-
169
-
170
-
171
-
172
-
173
-
174
-
175
-
176
-
177
-
178
-
179
-
180
-
181
-
182
-
183
-
184
-
185
-
186
-
187
-
188
-
189
-
190
-
191
-
192
-
193
-
194
-
195
-
196
-
197
-
198
-
199
-
200
-
201
-
202
-
203
-
204
-
205
-
206
-
207
-
208
-
209
-
210
-
211
-
212
-
213
-
214
-
215
-
216
-
217
-
218
-
219
-
220
-
221
-
222
-
223
-
224
-
225
-
226
-
227
-
228
-
229
-
230
-
231
-
232
-
233
-
234
-
235
-
236
-
237
-
238
-
239
-
240
-
241
-
242
-
243
-
244
-
245
-
246
-
247
-
248
-
249
-
250
-
251
-
252
-
253
-
254
-
255
-
256
-
257
-
258
-
259
-
260
-
261
-
262
-
263
-
264
-
265
-
266
-
267
-
268
-
269
-
270
-
271
-
272
-
273
-
274
-
275
-
276
-
277
-
278
-
279
-
280
-
281
-
282
-
283
-
284
-
285
-
286
-
287
-
288
-
289
-
290
-
291
-
292
-
293
-
294
-
295
-
296
-
297
-
298
-
299
-
300
 |
 |

Directors’ remuneration report
Directors’ remuneration report
BP Annual Report and Form 20-F 2011 149
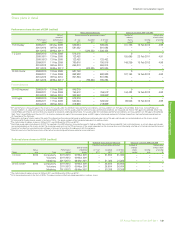
Performance share element of EDIP (audited)
Share element interests Interests vested in 2011 and 2012
Performance
period
Date of
award of
performance
shares
Potential maximum performance sharesaNumber of
ordinary
shares
vestedb
Vesting
date
Market price
of each share
at vesting
£
At 1 Jan
2011
Awarded
2011
At 31 Dec
2011
R W Dudleyc2009-2011 06 May 2009 539,634 –539,634 101,735 15 Feb 2012 4.98
2010-2012 09 Feb 2010 581,082 –581,082 – – –
2011-2013 09 Mar 2011d –1,330,332 1,330,332 – – –
I C Conn 2008-2010 13 Feb 2008 578,376 – – 0 – –
2008-2011e13 Feb 2008 133,452 – – 155,695 22 Feb 2011 4.91
2008-2013e13 Feb 2008 133,452 –133,452 – – –
2009-2011 11 Feb 2009 780,816 –780,816 149,259 15 Feb 2012 4.98
2010-2012 09 Feb 2010 656,813 –656,813 – – –
2011-2013 09 Mar 2011d–623,025 623,025 – – –
Dr B E Grotec2008-2010 13 Feb 2008 581,748 – – 0 – –
2009-2011 11 Feb 2009 992,928 –992,928 187,193 15 Feb 2012 4.98
2010-2012 09 Feb 2010 801,894 –801,894 – – –
2011-2013 09 Mar 2011d–785,394 785,394 – – –
Former directors
Dr A B Hayward 2008-2010 13 Feb 2008 845,319 – – 0 – –
2009-2011 11 Feb 2009 755,512 –755,512f144,422 15 Feb 2012 4.98
2010-2012 09 Feb 2010 303,948 –303,948f– – –
A G Inglis 2008-2010 13 Feb 2008 578,376 – – 0 – –
2009-2011 11 Feb 2009 520,544 –520,544f99,506 15 Feb 2012 4.98
2010-2012 09 Feb 2010 218,938 –218,938f– – –
a
BP’s performance is measured against the oil sector. For awards under the 2009-2011 plan, performance conditions are measured 50% on TSR against ExxonMobil, Shell, Total, ConocoPhillips and
Chevron and 50% on a balanced scorecard of underlying performance. For the awards under the 2010-2012 plan, performance conditions are measured one third on TSR against ExxonMobil, Shell, Total,
ConocoPhillips and Chevron and two thirds on a balanced scorecard of underlying performance. For awards under 2011-2013 plan, performance conditions are measured 50% on TSR against ExxonMobil,
Shell, Total, ConocoPhillips and Chevron; 20% on reserves replacement against the same peer group; and 30% against a balanced scorecard of strategic imperatives. Each performance period ends on
31 December of the third year.
b
Represents vestings of shares made at the end of the relevant performance period based on performance achieved under rules of the plan and includes re-invested dividends on the shares vested.
c
Dr Grote and Mr Dudley receive awards in the form of ADSs. The above numbers reflect calculated equivalents in ordinary shares.
d
The market price of ordinary shares on 9 March 2011 was £4.85 and for ADSs was $47.41.
e
Restricted award under share element of EDIP. As reported in the 2007 directors’ remuneration report in February 2008, the committee awarded Mr Conn restricted shares, as set out above and includes
re-invested dividends on the shares vested. The remaining award vests on the fifth anniversary of the award, dependent on the remuneration committee being satisfied as to their personal performance at
the date of vesting. Any unvested tranche will lapse in the event of cessation of employment with the company.
f
Potential maximum of performance shares reflect actual service during performance period on a pro-rated basis.
Deferred share element interests Interests vested in 2010 and 2011
Name
Bonus
year Type
Performance
period
Date of award
of deferred
sharesa
Potential maximum deferred shares Number of
ordinary
shares
vested
Vesting
date
Market price
of each share
at vesting
£
At 1 Jan
2011
Awarded
2011
At 31 Dec
2011
I C Conn 2010 Compulsory 2011-2013 09 Mar 2011 –21,384 21,384 – – –
Voluntary 2011-2013 09 Mar 2011 – – – – – –
Matching 2011-2013 09 Mar 2011 –21,384 21,384 –––
Dr B E Groteb2010 Compulsory 2011-2013 09 Mar 2011 –26,604 26,604 –––
Voluntary 2011-2013 09 Mar 2011 –26,604 26,604 –––
Matching 2011-2013 09 Mar 2011 –53,208 53,208 – – –
a The market price of ordinary shares on 9 March 2011 was £4.85 and for ADSs was $47.41.
b Dr Grote received awards in the form of ADSs. The above numbers reflect calculated equivalents in ordinary shares.
Deferred share element of EDIP (audited)
Share plans in detail