BP 2011 Annual Report Download - page 263
Download and view the complete annual report
Please find page 263 of the 2011 BP annual report below. You can navigate through the pages in the report by either clicking on the pages listed below, or by using the keyword search tool below to find specific information within the annual report.-
 1
1 -
2
-
3
-
4
-
5
-
6
-
7
-
8
-
9
-
10
-
11
-
12
-
13
-
14
-
15
-
16
-
17
-
18
-
19
-
20
-
21
-
22
-
23
-
24
-
25
-
26
-
27
-
28
-
29
-
30
-
31
-
32
-
33
-
34
-
35
-
36
-
37
-
38
-
39
-
40
-
41
-
42
-
43
-
44
-
45
-
46
-
47
-
48
-
49
-
50
-
51
-
52
-
53
-
54
-
55
-
56
-
57
-
58
-
59
-
60
-
61
-
62
-
63
-
64
-
65
-
66
-
67
-
68
-
69
-
70
-
71
-
72
-
73
-
74
-
75
-
76
-
77
-
78
-
79
-
80
-
81
-
82
-
83
-
84
-
85
-
86
-
87
-
88
-
89
-
90
-
91
-
92
-
93
-
94
-
95
-
96
-
97
-
98
-
99
-
100
-
101
-
102
-
103
-
104
-
105
-
106
-
107
-
108
-
109
-
110
-
111
-
112
-
113
-
114
-
115
-
116
-
117
-
118
-
119
-
120
-
121
-
122
-
123
-
124
-
125
-
126
-
127
-
128
-
129
-
130
-
131
-
132
-
133
-
134
-
135
-
136
-
137
-
138
-
139
-
140
-
141
-
142
-
143
-
144
-
145
-
146
-
147
-
148
-
149
-
150
-
151
-
152
-
153
-
154
-
155
-
156
-
157
-
158
-
159
-
160
-
161
-
162
-
163
-
164
-
165
-
166
-
167
-
168
-
169
-
170
-
171
-
172
-
173
-
174
-
175
-
176
-
177
-
178
-
179
-
180
-
181
-
182
-
183
-
184
-
185
-
186
-
187
-
188
-
189
-
190
-
191
-
192
-
193
-
194
-
195
-
196
-
197
-
198
-
199
-
200
-
201
-
202
-
203
-
204
-
205
-
206
-
207
-
208
-
209
-
210
-
211
-
212
-
213
-
214
-
215
-
216
-
217
-
218
-
219
-
220
-
221
-
222
-
223
-
224
-
225
-
226
-
227
-
228
-
229
-
230
-
231
-
232
-
233
-
234
-
235
-
236
-
237
-
238
-
239
-
240
-
241
-
242
-
243
-
244
-
245
-
246
-
247
-
248
-
249
-
250
-
251
-
252
-
 253
253 -
 254
254 -
 255
255 -
 256
256 -
 257
257 -
 258
258 -
 259
259 -
 260
260 -
 261
261 -
 262
262 -
 263
263 -
 264
264 -
 265
265 -
 266
266 -
 267
267 -
 268
268 -
 269
269 -
 270
270 -
 271
271 -
 272
272 -
 273
273 -
274
-
275
-
276
-
277
-
278
-
279
-
280
-
281
-
282
-
283
-
284
-
285
-
286
-
287
-
288
-
289
-
290
-
291
-
292
-
293
-
294
-
295
-
296
-
297
-
298
-
299
-
300
 |
 |

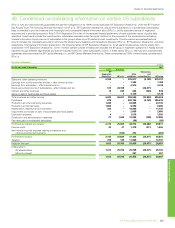
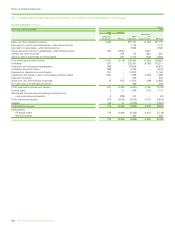
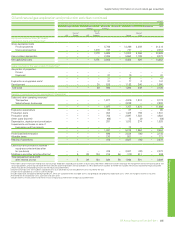
Financial statements
BP Annual Report and Form 20-F 2011 261
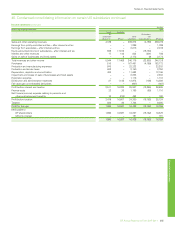
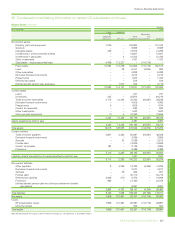
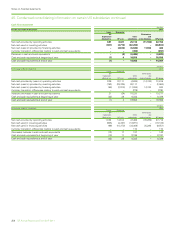
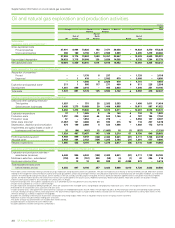
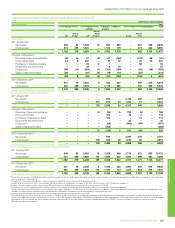
Supplementary information on oil and natural gas (unaudited)
Oil and natural gas exploration and production activities continued
$ million
2011
Europe North
America
South
America
Africa Asia Australasia Total
UK
Rest of
Europe US
Rest of
North
America Russia
Rest of
Asia
Equity-accounted entities (BP share)a
Capitalized costs at 31 Decemberb
Gross capitalized costs
Proved properties –––168 6,562 –16,214 3,571 –26,515
Unproved properties –––1,510 19 –652 9 – 2,190
–––1,678 6,581 –16,866 3,580 –28,705
Accumulated depreciation ––––2,644 –6,978 3,017 –12,639
Net capitalized costs –––1,678 3,937 –9,888 563 –16,066
Costs incurred for the year ended 31 Decemberb
Acquisition of propertiesc
Proved –––––––46 –46
Unproved ––––6–37 – – 43
––––6–37 46 –89
Exploration and appraisal costsd––––2–167 9 – 178
Development –––251 587 –1,862 435 –3,135
Total costs –––251 595 –2,066 490 –3,402
Results of operations for the year ended 31 December
Sales and other operating revenuese
Third parties ––––2,381 –7,380 3,828 –13,589
Sales between businesses ––––––5,149 23 –5,172
––––2,381 –12,529 3,851 –18,761
Exploration expenditure ––––10 –72 1 – 83
Production costs ––––459 –1,846 212 –2,517
Production taxes ––––1,098 –5,000 3,125 –9,223
Other costs (income) ––––(239) – 2 (1) –(238)
Depreciation, depletion and amortization ––––329 –988 431 –1,748
Impairments and (gains) losses on sale of
businesses and fixed assets ––––––––––
––––1,657 –7,908 3,768 –13,333
Profit (loss) before taxation ––––724 –4,621 83 –5,428
Allocable taxes ––––294 –806 19 –1,119
Results of operations ––––430 –3,815 64 –4,309
Exploration and production activities –
equity-accounted entities after tax
(as above) ––––430 –3,815 64 –4,309
Midstream and other activities after taxf–12 10 58 168 69 280 509 –1,106
Total replacement cost profit
after interest and tax –12 10 58 598 69 4,095 573 –5,415
a These tables contain information relating to oil and natural gas exploration and production activities of equity-accounted entities. They do not include amounts relating to assets held for sale. Midstream
activities relating to the management and ownership of crude oil and natural gas pipelines, processing and export terminals and LNG processing facilities and transportation as well as downstream
activities of TNK-BP are excluded. The amounts reported for equity-accounted entities exclude the corresponding amounts for their equity-accounted entities.
b Decommissioning assets are included in capitalized costs at 31 December but are excluded from costs incurred for the year.
c Includes costs capitalized as a result of asset exchanges.
d Includes exploration and appraisal drilling expenditures, which are capitalized within intangible assets, and geological and geophysical exploration costs, which are charged to income as incurred.
e Presented net of transportation costs and sales taxes.
f Includes interest, minority interest and the net results of equity-accounted entities of equity-accounted entities, and excludes inventory holding gains and losses.