BP 2011 Annual Report Download - page 213
Download and view the complete annual report
Please find page 213 of the 2011 BP annual report below. You can navigate through the pages in the report by either clicking on the pages listed below, or by using the keyword search tool below to find specific information within the annual report.-
 1
1 -
2
-
3
-
4
-
5
-
6
-
7
-
8
-
9
-
10
-
11
-
12
-
13
-
14
-
15
-
16
-
17
-
18
-
19
-
20
-
21
-
22
-
23
-
24
-
25
-
26
-
27
-
28
-
29
-
30
-
31
-
32
-
33
-
34
-
35
-
36
-
37
-
38
-
39
-
40
-
41
-
42
-
43
-
44
-
45
-
46
-
47
-
48
-
49
-
50
-
51
-
52
-
53
-
54
-
55
-
56
-
57
-
58
-
59
-
60
-
61
-
62
-
63
-
64
-
65
-
66
-
67
-
68
-
69
-
70
-
71
-
72
-
73
-
74
-
75
-
76
-
77
-
78
-
79
-
80
-
81
-
82
-
83
-
84
-
85
-
86
-
87
-
88
-
89
-
90
-
91
-
92
-
93
-
94
-
95
-
96
-
97
-
98
-
99
-
100
-
101
-
102
-
103
-
104
-
105
-
106
-
107
-
108
-
109
-
110
-
111
-
112
-
113
-
114
-
115
-
116
-
117
-
118
-
119
-
120
-
121
-
122
-
123
-
124
-
125
-
126
-
127
-
128
-
129
-
130
-
131
-
132
-
133
-
134
-
135
-
136
-
137
-
138
-
139
-
140
-
141
-
142
-
143
-
144
-
145
-
146
-
147
-
148
-
149
-
150
-
151
-
152
-
153
-
154
-
155
-
156
-
157
-
158
-
159
-
160
-
161
-
162
-
163
-
164
-
165
-
166
-
167
-
168
-
169
-
170
-
171
-
172
-
173
-
174
-
175
-
176
-
177
-
178
-
179
-
180
-
181
-
182
-
183
-
184
-
185
-
186
-
187
-
188
-
189
-
190
-
191
-
192
-
193
-
194
-
195
-
196
-
197
-
198
-
199
-
200
-
201
-
202
-
 203
203 -
 204
204 -
 205
205 -
 206
206 -
 207
207 -
 208
208 -
 209
209 -
 210
210 -
 211
211 -
 212
212 -
 213
213 -
 214
214 -
 215
215 -
 216
216 -
 217
217 -
 218
218 -
 219
219 -
 220
220 -
 221
221 -
 222
222 -
 223
223 -
224
-
225
-
226
-
227
-
228
-
229
-
230
-
231
-
232
-
233
-
234
-
235
-
236
-
237
-
238
-
239
-
240
-
241
-
242
-
243
-
244
-
245
-
246
-
247
-
248
-
249
-
250
-
251
-
252
-
253
-
254
-
255
-
256
-
257
-
258
-
259
-
260
-
261
-
262
-
263
-
264
-
265
-
266
-
267
-
268
-
269
-
270
-
271
-
272
-
273
-
274
-
275
-
276
-
277
-
278
-
279
-
280
-
281
-
282
-
283
-
284
-
285
-
286
-
287
-
288
-
289
-
290
-
291
-
292
-
293
-
294
-
295
-
296
-
297
-
298
-
299
-
300
 |
 |

Financial statements
BP Annual Report and Form 20-F 2011 211
Notes on financial statements
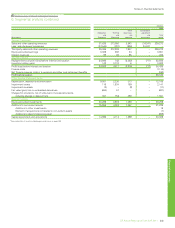
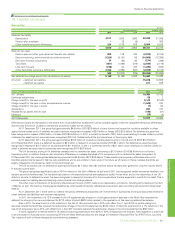
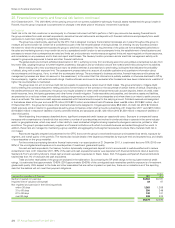
18. Taxation continued
Deferred tax
$ million
Income statement Balance sheet
2011 2010 2009 2011 2010
Deferred tax liability
Depreciation 4,511 1,565 1,983 33,038 27,309
Pension plan surpluses –38 (6) –469
Other taxable temporary differences 129 1,178 978 5,683 5,538
4,640 2,781 2,955 38,721 33,316
Deferred tax asset
Pension plan and other post-retirement benefit plan deficits 388 179 180 (2,872) (2,155)
Decommissioning, environmental and other provisions (1,324) (8,151) 86 (14,565) (13,296)
Derivative financial instruments 24 (56) 80 (274) (298)
Tax credits (401) (1,088) (516) (2,549) (2,118)
Loss carry forward (218) 24 402 (1,295) (943)
Other deductible temporary differences 2,040 (1,882) (567) (2,699) (4,126)
509 (10,974) (335) (24,254) (22,936)
Net deferred tax charge (credit) and net deferred tax liability 5,149 (8,193) 2,620 14,467 10,380
Of which – deferred tax liabilities 15,078 10,908
– deferred tax assets 611 528
$ million
Analysis of movements during the year 2011 2010
At 1 January 10,380 18,146
Exchange adjustments 55 3
Charge (credit) for the year on profit 5,149 (8,193)
Charge (credit) for the year in other comprehensive income (1,649) 244
Charge (credit) for the year in equity (7) 64
Acquisitions 692 187
Reclassified as assets held for sale (140) (67)
Deletions (13) (4)
At 31 December 14,467 10,380
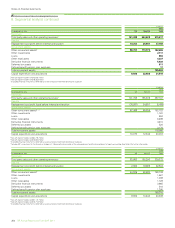
Deferred tax assets are recognized to the extent that it is probable that taxable profit will be available against which the deductible temporary differences
and the carry-forward of unused tax credits and unused tax losses can be utilized.
At 31 December 2011, the group had approximately $4.6 billion (2010 $3.9 billion) of carry-forward tax losses that would be available to offset
against future taxable profit. A deferred tax asset has been recognized in respect of $3.8 billion of losses (2010 $3.0 billion). No deferred tax asset has
been recognized in respect of $0.8 billion of losses (2010 $0.9 billion). In 2011, a current tax benefit of $0.1 billion arose relating to losses utilized on which
a deferred tax asset had not previously been recognized (2010 nil). Substantially all the tax losses have no fixed expiry date.
At 31 December 2011, the group had approximately $18.2 billion of unused tax credits predominantly in the UK and US (2010 $13.9 billion).
At 31 December 2011 there is a deferred tax asset of $2.5 billion in respect of unused tax credits (2010 $2.1 billion). No deferred tax asset has been
recognized in respect of $15.7 billion of tax credits (2010 $11.8 billion). In 2011, a current tax benefit of $0.1 billion arose relating to tax credits utilized on
which a deferred tax asset had not previously been recognized (2010 $0.3 billion).
The UK tax credits, arising in UK branches overseas with no deferred tax asset, amounting to $13.0 billion (2010 $9.9 billion) do not have a
fixed expiry date. In addition there are also temporary differences in overseas branches of UK companies with no deferred tax asset recognized. At
31 December 2011 the unrecognized deferred tax amounted to $0.9 billion (2010 $0.9 billion). These credits and temporary differences arise in UK
branches predominantly based in high tax rate jurisdictions and so are unlikely to have value in the future as UK taxes on these overseas branches are
largely mitigated by the double tax relief on the local foreign tax.
The US tax credits with no deferred tax asset amounting to $2.7 billion (2010 $1.9 billion) expire 10 years after generation, and the majority expire
in the period 2014-2021.
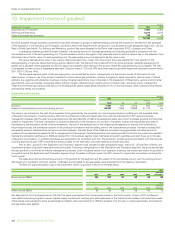
The group recognized significant costs in 2010 in relation to the Gulf of Mexico oil spill and in 2011 has recognized certain recoveries relating to the
incident as well as further costs. Tax has been calculated on the expenditures that are expected to qualify for tax relief, and on the recoveries, at the US
statutory tax rate. A deferred tax asset has been recognized in respect of provisions for future expenditure that are expected to qualify for tax relief. This is
included under the heading decommissioning, environmental and other provisions.
The other major components of temporary differences at the end of 2011 relate to tax depreciation, provisions, including items relating to the Gulf
of Mexico oil spill, US inventory holding gains (classified as other taxable temporary differences) and pension plan and other post-retirement benefit plan
deficits.
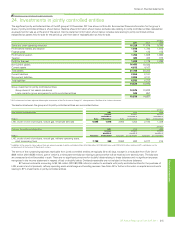
At 31 December 2011, there were no material temporary differences associated with investments in subsidiaries and equity-accounted entities for
which deferred tax liabilities have not been recognized.
In 2011, the enactment of a 12% increase in the UK supplementary charge on oil and gas production activities in the North Sea increased the
deferred tax charge in the income statement by $713 million of which $683 million relates to the revaluation of the opening deferred tax balance.
Also in 2011, the enactment of a 2% reduction in the rate of UK corporation tax to 25% with effect from 1 April 2012 on profits arising from
activities outside the North Sea reduced the deferred tax charge in the income statement by $120 million. In 2010 the enactment of a 1% reduction in the
rate of UK corporation tax to 27% with effect from 1 April 2011 similarly reduced the deferred tax charge in the income statement by $86 million.
In 2012, legislation to restrict relief for UK decommissioning expenditure from 62% to 50% is expected to be enacted. New legislation is also likely
to be introduced in Australia which would bring BP’s North West Shelf activities into the charge to Petroleum Resource Rent Tax (PRRT) from July 2012.
The impacts of both of these changes are currently being assessed.
http://www.bp.com/downloads/taxation