BP 2008 Annual Report Download - page 55
Download and view the complete annual report
Please find page 55 of the 2008 BP annual report below. You can navigate through the pages in the report by either clicking on the pages listed below, or by using the keyword search tool below to find specific information within the annual report.-
 1
1 -
2
-
3
-
4
-
5
-
6
-
7
-
8
-
9
-
10
-
11
-
12
-
13
-
14
-
15
-
16
-
17
-
18
-
19
-
20
-
21
-
22
-
23
-
24
-
25
-
26
-
27
-
28
-
29
-
30
-
31
-
32
-
33
-
34
-
35
-
36
-
37
-
38
-
39
-
40
-
41
-
42
-
43
-
44
-
 45
45 -
 46
46 -
 47
47 -
 48
48 -
 49
49 -
 50
50 -
 51
51 -
 52
52 -
 53
53 -
 54
54 -
 55
55 -
 56
56 -
 57
57 -
 58
58 -
 59
59 -
 60
60 -
 61
61 -
 62
62 -
 63
63 -
 64
64 -
 65
65 -
66
-
67
-
68
-
69
-
70
-
71
-
72
-
73
-
74
-
75
-
76
-
77
-
78
-
79
-
80
-
81
-
82
-
83
-
84
-
85
-
86
-
87
-
88
-
89
-
90
-
91
-
92
-
93
-
94
-
95
-
96
-
97
-
98
-
99
-
100
-
101
-
102
-
103
-
104
-
105
-
106
-
107
-
108
-
109
-
110
-
111
-
112
-
113
-
114
-
115
-
116
-
117
-
118
-
119
-
120
-
121
-
122
-
123
-
124
-
125
-
126
-
127
-
128
-
129
-
130
-
131
-
132
-
133
-
134
-
135
-
136
-
137
-
138
-
139
-
140
-
141
-
142
-
143
-
144
-
145
-
146
-
147
-
148
-
149
-
150
-
151
-
152
-
153
-
154
-
155
-
156
-
157
-
158
-
159
-
160
-
161
-
162
-
163
-
164
-
165
-
166
-
167
-
168
-
169
-
170
-
171
-
172
-
173
-
174
-
175
-
176
-
177
-
178
-
179
-
180
-
181
-
182
-
183
-
184
-
185
-
186
-
187
-
188
-
189
-
190
-
191
-
192
-
193
-
194
-
195
-
196
-
197
-
198
-
199
-
200
-
201
-
202
-
203
-
204
-
205
-
206
-
207
-
208
-
209
-
210
-
211
 |
 |

BP Annual Report and Accounts 2008
Performance review
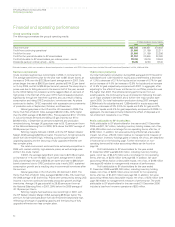
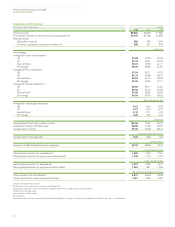
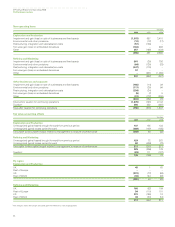
Refining and Marketing
$ million
2008 2007 2006
Total revenuesa 320,458 250,897 232,833
Profit before interest and tax from continuing operationsb (1,884) 6,076 4,919
$ per barrel
Global Indicator Refining Margin (GIM)c
Northwest Europe 6.72 4.99 3.92
US Gulf Coast 6.78 13.48 12.00
Midwest 5.17 12.81 9.14
US West Coast 7.42 15.05 14.84
Singapore 6.30 5.29 4.22
BP average 6.50 9.94 8.39
%
Refining availabilityd 88.8 82.9 82.5
thousand barrels per day
Refinery throughputs 2,155 2,127 2,198
aIncludes sales between businesses.
bIncludes profit after interest and tax of equity-accounted entities.
cThe GIM is the average of regional industry indicator margins that we weight for BP’s crude refining capacity in each region. Each regional indicator margin is based on a single representative crude with
product yields characteristic of the typical level of upgrading complexity. The refining margins are industry-specific rather than BP-specific measures, which we believe are useful to investors in analyzing
trends in the industry and their impact on our results. The margins are calculated by BP based on published crude oil and product prices and take account of fuel utilization and catalyst costs. No account
is taken of BP’s other cash and non-cash costs of refining, such as wages and salaries and plant depreciation. The indicator margin may not be representative of the margins achieved by BP in any period
because of BP’s particular refining configurations and crude and product slate.
dRefining availability represents Solomon Associates’ operational availability, which is defined as the percentage of the year that a unit is available for processing after subtracting the annualized time lost
due to turnaround activity and all planned mechanical, process and regulatory maintenance downtime.
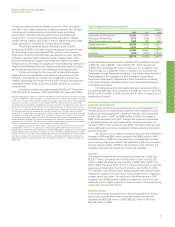
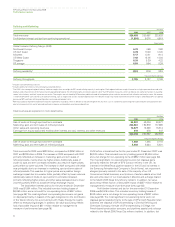
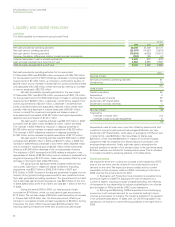
Total revenues are explained in more detail below.
$ million
2008 2007 2006
Sale of crude oil through spot and term contracts 54,901 43,004 38,577
Marketing, spot and term sales of refined products 248,561 194,979 177,995
Other sales and operating revenues 16,577 12,238 15,814
Earnings from equity-accounted entities (after interest and tax), interest, and other revenues 419 676 447
320,458 250,897 232,833
thousand barrels per day
Sale of crude oil through spot and term contracts 1,689 1,885 2,110
Marketing, spot and term sales of refined products 5,698 5,624 5,801
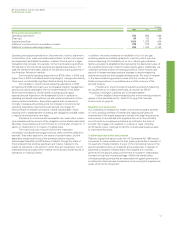
Total revenues for 2008 were $320 billion, compared with $251 billion in
2007 and $233 billion in 2006. The increase in 2008 compared with 2007
primarily reflected an increase in marketing, spot and term sales of
refined products, mainly driven by higher prices. Additionally, sales of
crude oil, spot and term contracts increased, as a result of higher prices,
partly offset by lower volumes. The increase in 2007 compared with 2006
was principally due to an increase in marketing, spot and term sales of
refined products. This was due to higher prices and a positive foreign
exchange impact due to a weaker dollar, partially offset by lower volumes.
Additionally, sales of crude oil, spot and term contracts increased,
primarily reflecting higher prices, and other sales decreased due to lower
volumes partially offset by a positive foreign exchange impact.
The loss before interest and tax for the year ended 31 December
2008 was $1,884 million. This included inventory holding losses of
$6,060 million and a net credit for non-operating items of $347 million
(see page 56). The most significant non-operating items were net gains
on disposal (primarily in respect of the gain recognized on the contribution
of the Toledo refinery into a joint venture with Husky Energy Inc.) partly
offset by restructuring charges. In addition, fair value accounting effects
had a favourable impact of $511 million relative to management’s
measure of performance (see page 56).
Profit before interest and tax for the year ended 31 December 2007 was
$6,076 million. This included inventory holding gains of $3,455 million
and a net charge for non-operating items of $952 million (see page 56).
The most significant non-operating items were net disposal gains
(primarily related to the sale of BP’s Coryton refinery in the UK, its
interest in the West Texas pipeline system in the US and its interest in
the Samsung Petrochemical Company in South Korea), net impairment
charges (primarily related to the sale of the majority of our US
Convenience Retail business, a write-down of certain assets at our Hull
site and write-down of our retail assets in Mexico) and a charge related
to the March 2005 Texas City refinery incident. In addition, fair value
accounting effects had an unfavourable impact of $357 million relative to
management’s measure of performance (see page 56).
Profit before interest and tax for the year ended 31 December
2006 was $4,919 million. This included inventory holding losses of
$242 million and a net charge for non-operating items of $387 million
(see page 56). The most significant non-operating items were net
disposal gains (related primarily to the sale of BP’s Czech Republic retail
business, the disposal of BP’s shareholding in Zhenhai Refining and
Chemicals Company, the sale of BP’s shareholding in Eiffage, the
French-based construction company, and pipelines assets) and a charge
related to the March 2005 Texas City refinery incident. In addition, fair
54