BP 2008 Annual Report Download - page 131
Download and view the complete annual report
Please find page 131 of the 2008 BP annual report below. You can navigate through the pages in the report by either clicking on the pages listed below, or by using the keyword search tool below to find specific information within the annual report.-
 1
1 -
2
-
3
-
4
-
5
-
6
-
7
-
8
-
9
-
10
-
11
-
12
-
13
-
14
-
15
-
16
-
17
-
18
-
19
-
20
-
21
-
22
-
23
-
24
-
25
-
26
-
27
-
28
-
29
-
30
-
31
-
32
-
33
-
34
-
35
-
36
-
37
-
38
-
39
-
40
-
41
-
42
-
43
-
44
-
45
-
46
-
47
-
48
-
49
-
50
-
51
-
52
-
53
-
54
-
55
-
56
-
57
-
58
-
59
-
60
-
61
-
62
-
63
-
64
-
65
-
66
-
67
-
68
-
69
-
70
-
71
-
72
-
73
-
74
-
75
-
76
-
77
-
78
-
79
-
80
-
81
-
82
-
83
-
84
-
85
-
86
-
87
-
88
-
89
-
90
-
91
-
92
-
93
-
94
-
95
-
96
-
97
-
98
-
99
-
100
-
101
-
102
-
103
-
104
-
105
-
106
-
107
-
108
-
109
-
110
-
111
-
112
-
113
-
114
-
115
-
116
-
117
-
118
-
119
-
120
-
 121
121 -
 122
122 -
 123
123 -
 124
124 -
 125
125 -
 126
126 -
 127
127 -
 128
128 -
 129
129 -
 130
130 -
 131
131 -
 132
132 -
 133
133 -
 134
134 -
 135
135 -
 136
136 -
 137
137 -
 138
138 -
 139
139 -
 140
140 -
 141
141 -
142
-
143
-
144
-
145
-
146
-
147
-
148
-
149
-
150
-
151
-
152
-
153
-
154
-
155
-
156
-
157
-
158
-
159
-
160
-
161
-
162
-
163
-
164
-
165
-
166
-
167
-
168
-
169
-
170
-
171
-
172
-
173
-
174
-
175
-
176
-
177
-
178
-
179
-
180
-
181
-
182
-
183
-
184
-
185
-
186
-
187
-
188
-
189
-
190
-
191
-
192
-
193
-
194
-
195
-
196
-
197
-
198
-
199
-
200
-
201
-
202
-
203
-
204
-
205
-
206
-
207
-
208
-
209
-
210
-
211
 |
 |

BP Annual Report and Accounts 2008
Notes on financial statements
12. Impairment review of goodwill continued
group’s assumption for Henry Hub natural gas prices is an average of $6.16/mmBtu in 2009, $7.15/mmBtu in 2010, $7.34/mmBtu in 2011,
$7.62/mmBtu in 2012, $7.60/mmBtu in 2013 and $7.50/mmBtu in 2014 and beyond (2007 average of $7.87/mmBtu in 2008, $8.33/mmBtu in 2009,
$8.26/mmBtu in 2010, $8.12/mmBtu in 2011, $8.00/mmBtu in 2012 and $7.50/mmBtu in 2013 and beyond). The prices for the first five years are
derived from forward price curves at the year-end. Prices in 2014 and beyond are determined using long-term views of global supply and demand,
building upon past experience of the industry and consistent with a number of external economic forecasts. These prices are adjusted to arrive at
appropriate consistent price assumptions for different qualities of oil and gas.
Exploration and Production
The value in use is based on the cash flows expected to be generated by the projected oil or natural gas production profiles up to the expected dates
of cessation of production of each producing field. Management believes that the cash flows generated over the estimated life of field is the
appropriate basis upon which to assess goodwill and individual assets for impairment, as the production profile and related cash flows can be
estimated from the company’s past experience. The date of cessation of production depends on the interaction of a number of variables, such as the
recoverable quantities of hydrocarbons, the production profile of the hydrocarbons, the cost of the development of the infrastructure necessary to
recover the hydrocarbons, the production costs, the contractual duration of the production concession and the selling price of the hydrocarbons
produced. As each producing field has specific reservoir characteristics and economic circumstances, the cash flows of the fields are computed using
appropriate individual economic models and key assumptions agreed by BP’s management for the purpose. Capital expenditure and operating costs
for the first four years and expected hydrocarbon production profiles up to 2020 are derived from the business segment plan. Estimated production
quantities and cash flows up to the date of cessation of production on a field-by-field basis are developed to be consistent with this. The production
profiles used are consistent with the resource volumes approved as part of BP’s centrally-controlled process for the estimation of proved reserves and
total resources.
Consistent with prior years, the 2008 review for impairment was carried out during the fourth quarter. Detailed calculations were performed for
the US and the UK. As permitted by IAS 36, the detailed calculations performed in 2005 were used for the 2008 impairment test on the goodwill for
the Rest of World as the criteria of IAS 36 were considered to be satisfied: the excess of the recoverable amount over the carrying amount was
substantial in 2005; there had been no significant change in the assets and liabilities; and the likelihood that the recoverable amount would be less than
the carrying amount at the time of the test was remote.
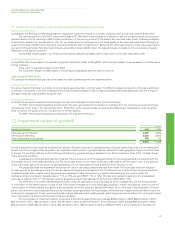
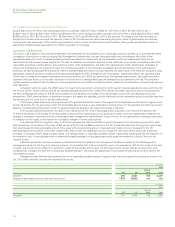
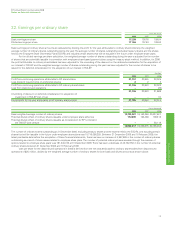
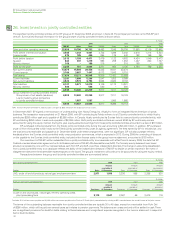
The following table shows the carrying amount of the goodwill allocated to each of the regions of the Exploration and Production segment and,
for the US and the UK, the amount by which the recoverable amount (value in use) exceeds the carrying amount of the goodwill and other non-current
assets in the cash-generating units to which the goodwill has been allocated. No impairment charge is required.
The key assumptions required for the value-in-use estimation are the oil and natural gas prices, production volumes and the discount rate.
To test the sensitivity of the excess of the recoverable amount over the carrying amount of goodwill and other non-current assets (the headroom) to
changes in production volumes and oil and natural gas prices, management has developed ‘rules of thumb’ for key assumptions. Applying these gives
an indication of the impact on the headroom of possible changes in the key assumptions.
It is estimated that the long-term price of oil that would cause the total recoverable amount to be equal to the total carrying amount for each
cash-generating unit would be of the order of $38 per barrel for the UK and $50 per barrel for the US. It was estimated that the long-term price of gas
that would cause the total recoverable amount to be equal to the total carrying amount of goodwill and related non-current assets for the US
cash-generating unit would be of the order of $4/mmBtu (Henry Hub). As a significant amount of gas from the North Sea is sold under fixed-price
contracts, or contracts priced using non-gas indices, it is estimated that no reasonably possible change in gas prices would cause the UK headroom to
be reduced to zero. It was estimated that no reasonably possible change in oil and gas prices would cause the headroom in Rest of World to be
reduced to zero.
Estimated production volumes are based on detailed data for the fields and take into account development plans for the fields agreed by
management as part of the long-term planning process. It is estimated that, if all our production were to be reduced by 10% for the whole of the next
15 years, this would not be sufficient to reduce the excess of recoverable amount over the carrying amounts of each cash-generating unit to zero.
Consequently, management believes no reasonably possible change in the production assumption would cause the carrying amounts to exceed the
recoverable amounts.
Management also believes that currently there is no reasonably possible change in discount rate that would cause the carrying amounts in the
UK, US or Rest of World to exceed the recoverable amounts.
$ million
2008
Rest of
UK US World Total
Goodwill 341 3,441 515 4,297
Excess of recoverable amount over carrying amount 7,972 16,692 n/a n/a
$ million
2007
Rest of
UK US World Total
Goodwill 341 3,440 515 4,296
130