BP 2008 Annual Report Download - page 132
Download and view the complete annual report
Please find page 132 of the 2008 BP annual report below. You can navigate through the pages in the report by either clicking on the pages listed below, or by using the keyword search tool below to find specific information within the annual report.-
 1
1 -
2
-
3
-
4
-
5
-
6
-
7
-
8
-
9
-
10
-
11
-
12
-
13
-
14
-
15
-
16
-
17
-
18
-
19
-
20
-
21
-
22
-
23
-
24
-
25
-
26
-
27
-
28
-
29
-
30
-
31
-
32
-
33
-
34
-
35
-
36
-
37
-
38
-
39
-
40
-
41
-
42
-
43
-
44
-
45
-
46
-
47
-
48
-
49
-
50
-
51
-
52
-
53
-
54
-
55
-
56
-
57
-
58
-
59
-
60
-
61
-
62
-
63
-
64
-
65
-
66
-
67
-
68
-
69
-
70
-
71
-
72
-
73
-
74
-
75
-
76
-
77
-
78
-
79
-
80
-
81
-
82
-
83
-
84
-
85
-
86
-
87
-
88
-
89
-
90
-
91
-
92
-
93
-
94
-
95
-
96
-
97
-
98
-
99
-
100
-
101
-
102
-
103
-
104
-
105
-
106
-
107
-
108
-
109
-
110
-
111
-
112
-
113
-
114
-
115
-
116
-
117
-
118
-
119
-
120
-
121
-
 122
122 -
 123
123 -
 124
124 -
 125
125 -
 126
126 -
 127
127 -
 128
128 -
 129
129 -
 130
130 -
 131
131 -
 132
132 -
 133
133 -
 134
134 -
 135
135 -
 136
136 -
 137
137 -
 138
138 -
 139
139 -
 140
140 -
 141
141 -
 142
142 -
143
-
144
-
145
-
146
-
147
-
148
-
149
-
150
-
151
-
152
-
153
-
154
-
155
-
156
-
157
-
158
-
159
-
160
-
161
-
162
-
163
-
164
-
165
-
166
-
167
-
168
-
169
-
170
-
171
-
172
-
173
-
174
-
175
-
176
-
177
-
178
-
179
-
180
-
181
-
182
-
183
-
184
-
185
-
186
-
187
-
188
-
189
-
190
-
191
-
192
-
193
-
194
-
195
-
196
-
197
-
198
-
199
-
200
-
201
-
202
-
203
-
204
-
205
-
206
-
207
-
208
-
209
-
210
-
211
 |
 |

131
BP Annual Report and Accounts 2008
Notes on financial statements
Financial statements
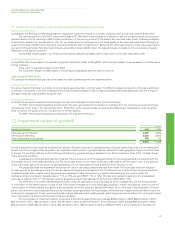
12. Impairment review of goodwill continued
Refining and Marketing
In previous years, Refining and Marketing goodwill has been allocated to the following cash-generating units: Refining, Retail, Lubricants, and Other.
In 2008, the Refining and Retail units were largely integrated into geographically-based Fuels Value Chain units (FVC) and consequently the cash-
generating units to which goodwill is allocated have been redefined. The goodwill previously allocated to the global Refining and Retail units has
been aggregated and reallocated to the FVC units that are expected to benefit from the synergies of the business combinations that gave rise to the
goodwill. As part of this reallocation a small amount of goodwill was also allocated to business units included in ‘Other’. Goodwill is now allocated
to the following cash-generating units: Rhine FVC, US West Coast FVC, Lubricants and Other.
For all cash-generating units, the cash flows for the first three years are derived from the three-year business segment plan. For determining
the value in use for each of the cash-generating units, cash flows for a period of 10 years have been discounted and aggregated with a terminal value.
A key assumption for the FVCs is the Global Indicator Margin (GIM). Each regional GIM is based on a single representative crude with product yields
characteristic of the typical level of upgrading complexity.
Rhine FVC
Cash flows beyond the three-year period are extrapolated using a 1.2% growth rate.
The key assumptions to which the calculation of value in use for the Rhine FVC unit is most sensitive are refinery gross margins, refinery
production volumes and discount rate. The average value assigned to the refinery gross margin during the plan period is based on a $5.50 per barrel
GIM. The average value assigned to the refinery production volume is 250mmbbl a year over the plan period. These key assumptions reflect past
experience and are consistent with external sources.
The Rhine FVC’s recoverable amount exceeds its carrying amount by $3.6 billion. Based on sensitivity analysis, it is estimated that: (i) if the GIM
changes by $1 per barrel, the Rhine FVC’s value in use changes by $2.1 billion and, if there was an adverse change in the GIM of $1.70 per barrel, the
recoverable amount of the Rhine FVC would equal its carrying amount; (ii) if the volume assumption changes by 13mmbbl a year, the Rhine FVC’s value
in use changes by $1.2 billion and, if there is an adverse change in refinery volumes of 36mmbbl a year, the recoverable amount of the Rhine FVC
would equal its carrying amount; and (iii) a change of 1% in the discount rate would change the Rhine FVC’s value in use by $0.8 billion and, if the
discount rate increases to 17% the value in use of the Rhine FVC would equal its carrying amount.
US West Coast FVC
Cash flows beyond the three-year period are extrapolated using a 2% growth rate.
The key assumptions to which the calculation of value in use for the West Coast FVC unit is most sensitive are refinery gross margins, refinery
production volumes and discount rate. The average value assigned to the refinery gross margin during the plan period is based on a $7.60 per barrel
GIM. The average value assigned to the refinery production volume is 170mmbbl a year over the plan period. These key assumptions reflect past
experience and are consistent with external sources.
The West Coast FVC’s recoverable amount exceeds its carrying amount by $1.6 billion. Based on sensitivity analysis, it is estimated that: (i) if the
GIM changes by $1 per barrel, the West Coast FVC’s value in use changes by $1.5 billion and, if there was an adverse change in the GIM of $1.10 per
barrel, the recoverable amount of the West Coast FVC would equal its carrying amount; (ii) if the volume assumption changes by 8mmbbl a year, the
West Coast FVC’s value in use changes by $1.1 billion and, if there is an adverse change in refinery volumes of 12mmbbl a year, the recoverable
amount of the West Coast FVC would equal its carrying amount; and (iii) a change of 1% in the discount rate would change the West Coast FVC’s value
in use by $0.6 billion and, if the discount rate increases to 14% the value in use of the West Coast FVC would equal its carrying amount.
Lubricants
Cash flows beyond the three-year period are extrapolated using a 3% growth rate (2007 3%).
For the Lubricants unit, the key assumptions to which the calculation of value in use is most sensitive are operating margin, sales volumes and
discount rate. The average values assigned to the operating margin and sales volumes over the plan period are 70 cents per litre (2007 65 cents per
litre) and 3.4 billion litres a year (2007 3.3 billion litres a year) respectively. These key assumptions reflect past experience.
The Lubricants unit’s recoverable amount exceeds its carrying amount by $5.4 billion. Based on sensitivity analysis, it is estimated that: (i) if
there is an adverse change in the operating margin of 14 cents per litre, the recoverable amount of the Lubricants unit would equal its carrying amount;
(ii) if the sales volume assumption changes by 200 million litres a year, the Lubricants unit’s value in use changes by $1.4 billion and, if there is an
adverse change in Lubricants sales volumes of 700 million litres a year, the recoverable amount of the Lubricants unit would equal its carrying amount;
and (iii) a change of 1% in the discount rate would change the Lubricants unit’s value in use by $1.4 billion and, management believes no reasonably
possible change in the discount rate would lead to the Lubricants unit’s value in use being equal to its carrying amount.
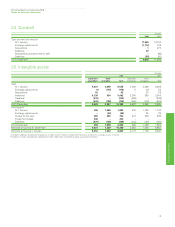
$ million
2008
US West
Rhine FVC Coast FVC Lubricants Other Total
Goodwill 637 1,579 3,043 203 5,462
Excess of recoverable amount over carrying amount 3,603 1,629 5,445 n/a n/a
$ million
2007
Refining Retail Lubricants Other Total
Goodwill 1,515 827 4,175 109 6,626
Excess of recoverable amount over carrying amount 11,443 4,062 5,028 n/a n/a
Comparative narrative information is not generally shown because, due to the reorganization of the Refining and Marketing business in 2008, the
information is not relevant to an understanding of the current year’s financial statements.