BP 2008 Annual Report Download - page 183
Download and view the complete annual report
Please find page 183 of the 2008 BP annual report below. You can navigate through the pages in the report by either clicking on the pages listed below, or by using the keyword search tool below to find specific information within the annual report.-
 1
1 -
2
-
3
-
4
-
5
-
6
-
7
-
8
-
9
-
10
-
11
-
12
-
13
-
14
-
15
-
16
-
17
-
18
-
19
-
20
-
21
-
22
-
23
-
24
-
25
-
26
-
27
-
28
-
29
-
30
-
31
-
32
-
33
-
34
-
35
-
36
-
37
-
38
-
39
-
40
-
41
-
42
-
43
-
44
-
45
-
46
-
47
-
48
-
49
-
50
-
51
-
52
-
53
-
54
-
55
-
56
-
57
-
58
-
59
-
60
-
61
-
62
-
63
-
64
-
65
-
66
-
67
-
68
-
69
-
70
-
71
-
72
-
73
-
74
-
75
-
76
-
77
-
78
-
79
-
80
-
81
-
82
-
83
-
84
-
85
-
86
-
87
-
88
-
89
-
90
-
91
-
92
-
93
-
94
-
95
-
96
-
97
-
98
-
99
-
100
-
101
-
102
-
103
-
104
-
105
-
106
-
107
-
108
-
109
-
110
-
111
-
112
-
113
-
114
-
115
-
116
-
117
-
118
-
119
-
120
-
121
-
122
-
123
-
124
-
125
-
126
-
127
-
128
-
129
-
130
-
131
-
132
-
133
-
134
-
135
-
136
-
137
-
138
-
139
-
140
-
141
-
142
-
143
-
144
-
145
-
146
-
147
-
148
-
149
-
150
-
151
-
152
-
153
-
154
-
155
-
156
-
157
-
158
-
159
-
160
-
161
-
162
-
163
-
164
-
165
-
166
-
167
-
168
-
169
-
170
-
171
-
172
-
 173
173 -
 174
174 -
 175
175 -
 176
176 -
 177
177 -
 178
178 -
 179
179 -
 180
180 -
 181
181 -
 182
182 -
 183
183 -
 184
184 -
 185
185 -
 186
186 -
 187
187 -
 188
188 -
 189
189 -
 190
190 -
 191
191 -
 192
192 -
 193
193 -
194
-
195
-
196
-
197
-
198
-
199
-
200
-
201
-
202
-
203
-
204
-
205
-
206
-
207
-
208
-
209
-
210
-
211
 |
 |

–
BP Annual Report and Accounts 2008
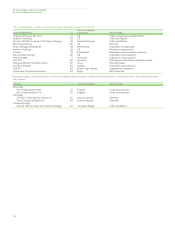
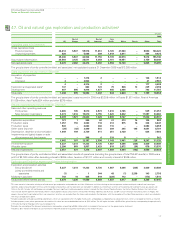
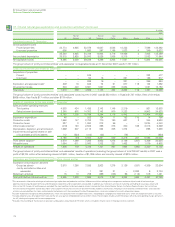
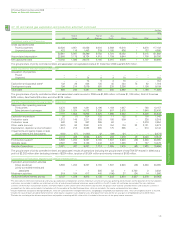
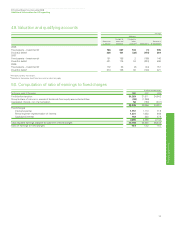
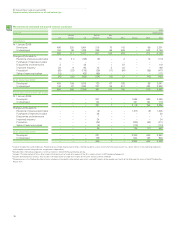
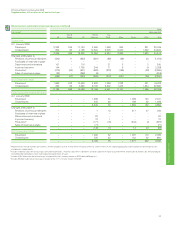
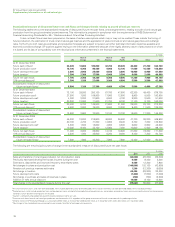
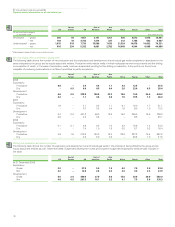
Supplementary information on oil and natural gas
Supplementary information on oil and natural gas
Movements in estimated net proved reserves
For details of BP’s governance process for the booking of oil and natural gas reserves, see page 19. BP estimates proved reserves for reporting
purposes in accordance with SEC rules and relevant guidance. As currently required, these proved reserve estimates are based on prices and costs as
of the date the estimate is made. There was a rapid and substantial decline in oil prices in the fourth quarter of 2008 that was not matched by a similar
reduction in operating costs by the end of the year. BP does not expect that these economic conditions will continue. However, our 2008 reserves are
calculated on the basis of operating activities that would be undertaken were year-end prices and costs to persist.
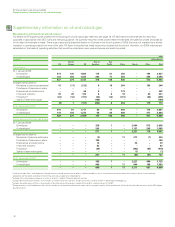
2008
Crude oilamillion barrels
Rest of Rest of Asia
UK Europe US Americas Pacific Africa Russia Other Total
Subsidiaries
At 1 January 2008
Developed 414 105 1,882 115 61 256 – 104 2,937
Undeveloped 123 169 1,265 203 77 350 – 368 2,555
537 274 3,147 318 138 606 – 472 5,492
Changes attributable to
Revisions of previous estimates 16 (11) (212) 8 16 264 – 183 264
Purchases of reserves-in-place ––– –––––
Discoveries and extensions – – 64 5 – 173 – – 242
Improved recovery 39 28 182 8 6 18 – 40 321
Productionb(63) (16) (191) (26) (14) (101) – (44) (455)
Sales of reserves-in-place – – – (199) – – – – (199)
(8) 1 (157) (204) 8 354 – 179 173
At 31 December 2008c
Developed 410 81 1,717 58 77 464 – 174 2,981
Undeveloped 119 194 1,273 56 69 496 – 477 2,684
529 275 2,990e114 146 960 – 651 5,665
Equity-accounted entities (BP share)
At 1 January 2008
Developed – – – 328 1 – 2,094 573 2,996
Undeveloped – – – 243 – – 1,137 205 1,585
– – – 571 1 – 3,231 778 4,581
Changes attributable to
Revisions of previous estimates – – – (3) – 11 217 (1) 224
Purchases of reserves-in-place – – – 199 – – – – 199
Discoveries and extensions – – – 13 – – 26 – 39
Improved recovery – – – 62 – – – – 62
Production – – – (34) – – (302) (80) (416)
Sales of reserves-in-place – – – – – – (1) – (1)
– – – 237 – 11 (60) (81) 107
At 31 December 2008d
Developed – – – 399 1 – 2,227 498 3,125
Undeveloped – – – 409 – 11 944 199 1,563
– – – 808 1 11 3,171 697 4,688
aCrude oil includes NGLs and condensate. Proved reserves exclude royalties due to others, whether payable in cash or in kind where the royalty owner has a direct interest in the underlying
production and the option and ability to make lifting and sales arrangements independently.
bExcludes NGLs from processing plants in which an interest is held of 19 thousand barrels per day.
cIncludes 807 million barrels of NGLs. Also includes 21 million barrels of crude oil in respect of the 30% minority interest in BP Trinidad and Tobago LLC.
dIncludes 36 million barrels of NGLs. Also includes 216 million barrels of crude oil in respect of the 6.80% minority interest in TNK-BP.
eProved reserves in the Prudhoe Bay field in Alaska include an estimated 54 million barrels upon which a net profits royalty will be payable over the life of the field under the terms of the BP Prudhoe
Bay Royalty Trust.
182