BP 2008 Annual Report Download - page 33
Download and view the complete annual report
Please find page 33 of the 2008 BP annual report below. You can navigate through the pages in the report by either clicking on the pages listed below, or by using the keyword search tool below to find specific information within the annual report.-
 1
1 -
2
-
3
-
4
-
5
-
6
-
7
-
8
-
9
-
10
-
11
-
12
-
13
-
14
-
15
-
16
-
17
-
18
-
19
-
20
-
21
-
22
-
 23
23 -
 24
24 -
 25
25 -
 26
26 -
 27
27 -
 28
28 -
 29
29 -
 30
30 -
 31
31 -
 32
32 -
 33
33 -
 34
34 -
 35
35 -
 36
36 -
 37
37 -
 38
38 -
 39
39 -
 40
40 -
 41
41 -
 42
42 -
 43
43 -
44
-
45
-
46
-
47
-
48
-
49
-
50
-
51
-
52
-
53
-
54
-
55
-
56
-
57
-
58
-
59
-
60
-
61
-
62
-
63
-
64
-
65
-
66
-
67
-
68
-
69
-
70
-
71
-
72
-
73
-
74
-
75
-
76
-
77
-
78
-
79
-
80
-
81
-
82
-
83
-
84
-
85
-
86
-
87
-
88
-
89
-
90
-
91
-
92
-
93
-
94
-
95
-
96
-
97
-
98
-
99
-
100
-
101
-
102
-
103
-
104
-
105
-
106
-
107
-
108
-
109
-
110
-
111
-
112
-
113
-
114
-
115
-
116
-
117
-
118
-
119
-
120
-
121
-
122
-
123
-
124
-
125
-
126
-
127
-
128
-
129
-
130
-
131
-
132
-
133
-
134
-
135
-
136
-
137
-
138
-
139
-
140
-
141
-
142
-
143
-
144
-
145
-
146
-
147
-
148
-
149
-
150
-
151
-
152
-
153
-
154
-
155
-
156
-
157
-
158
-
159
-
160
-
161
-
162
-
163
-
164
-
165
-
166
-
167
-
168
-
169
-
170
-
171
-
172
-
173
-
174
-
175
-
176
-
177
-
178
-
179
-
180
-
181
-
182
-
183
-
184
-
185
-
186
-
187
-
188
-
189
-
190
-
191
-
192
-
193
-
194
-
195
-
196
-
197
-
198
-
199
-
200
-
201
-
202
-
203
-
204
-
205
-
206
-
207
-
208
-
209
-
210
-
211
 |
 |

BP Annual Report and Accounts 2008
Performance review
Looking ahead, in 2009 the overall economic environment is expected to
be challenging with reduced demand for our products leading to lower
volumes and pressure on margins. The impact is expected to be greatest
in the petrochemicals sector.
Against this background, we intend to continue actively managing
our cost base, simplifying our marketing footprint and developing the market
positions where we have competitive advantage based on brand and
technology strengths. We also intend to improve the efficiency of our back
office, including customer service, accounting services and procurement
systems, by centralizing these activities in a few global centres to remove
duplication and reduce cost. We intend to focus on cash generation through
active management of our working capital and credit exposure.
We intend to limit our capital investment to maintaining and improving our
core positions. To continue the progress we have made in recent years, our
top priority for spending will remain safety and operational integrity. The
other area of focus will be delivering integrated value in our key markets
through investment in terminals and pipeline infrastructure. Our largest
investment is expected to be at the Whiting refinery, where we have
started a major upgrading and modernization programme that will enable
the refinery to operate on Canadian heavy crude oil. We also intend to
complete the planned projects in petrochemicals (see page 36).
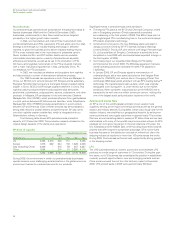
Comparative information presented in the table below has been
restated, where appropriate, to reflect the resegmentation, following
transfers of businesses between segments, that was effective from
1 January 2008. See page 16 for further details.
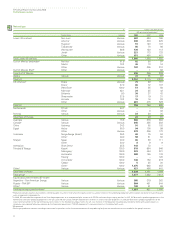
Key statistics
$ million
2008 2007 2006
Total revenuesa 320,458 250,897 232,833
Profit before interest and tax from
continuing operationsb (1,884) 6,076 4,919
Total assets 75,329 95,311 80,738
Capital expenditure and acquisitions 6,634 5,495 3,127
$ per barrel
Global Indicator Refining Marginc 6.50 9.94 8.39
aIncludes sales between businesses.
bIncludes profit after interest and tax of equity-accounted entities.
cThe Global Indicator Refining Margin (GIM) is the average of regional industry indicator margins,
which we weight for BP’s crude refining capacity in each region. Each regional indicator margin is
based on a single representative crude with product yields characteristic of the typical level of
upgrading complexity. The refining margins are industry-specific rather than BP-specific measures,
which we believe are useful to investors in analyzing trends in the industry and their impact on our
results. The margins are calculated by BP based on published crude oil and product prices and take
account of fuel utilization and catalyst costs. No account is taken of BP’s other cash and non-cash
costs of refining, such as wages and salaries and plant depreciation. The indicator margin may not
be representative of the margins achieved by BP in any period because of BP’s particular refining
configurations and crude and product slate.
Total revenues are analysed in more detail below.
$ million
2008 2007 2006
Sale of crude oil through spot and
term contracts
Marketing, spot and term sales
of refined products
Other sales and operating revenues
Earnings from equity-accounted
entities (after interest and tax),
interest, and other revenues
54,901
248,561
16,577
419
43,004
194,979
12,238
676
38,577
177,995
15,814
447
320,458 250,897 232,833
thousand barrels per day
Sale of crude oil through spot and
term contracts
Marketing, spot and term sales
of refined products
1,689
5,698
1,885
5,624
2,110
5,801
thousand barrels per day
Sales of refined productsa 2008 2007 2006
Marketing sales
UKb 310 339 356
Rest of Europe 1,256 1,294 1,340
US 1,460 1,533 1,595
Rest of World 685 640 581
Total marketing salesc 3,711 3,806 3,872
Trading/supply salesd 1,987 1,818 1,929
Total refined products 5,698 5,624 5,801
$ million
Proceeds from sale of refined
products 248,561 194,979 177,995
aExcludes sales to other BP businesses, sales of Aromatics & Acetyls products and Olefins &
Derivatives sales through equity-accounted entities.
bUK area includes the UK-based international activities of Refining and Marketing.
cMarketing sales are sales to service stations, end-consumers, bulk buyers and jobbers (i.e. third
parties who own networks of a number of service stations and small resellers).
dTrading/supply sales are sales to large unbranded resellers and other oil companies.
The following table sets out marketing sales by major product group.
thousand barrels per day
Marketing sales by refined product 2008 2007 2006
Aviation fuel 501 490 488
Gasolines 1,500 1,572 1,603
Middle distillates 1,055 1,119 1,170
Fuel oil 460 429 388
Other products 195 196 223
Total marketing sales 3,711 3,806 3,872
Marketing volumes were 3,711mb/d, slightly lower than last year,
reflecting the impacts from the slowing of global economies and reduced
industry demand in the US and Europe.
Fuels value chains
Following our reorganization we have six integrated FVCs. They are
organized regionally, covering the West Coast and Mid-West regions of
the US, the Rhine region, Southern Africa, Australasia (ANZ) and Iberia.
Each of these is a material business, optimizing activities across the
supply chain – from crude delivery to the refineries; manufacture
of high-quality fuels to meet market demand; pipeline and terminal
infrastructure and the marketing and sales to our customers. The Texas
City refinery is operated as a standalone predominantly merchant refining
business that also supports our marketing operations on the east and
gulf coasts.
Refining
The group’s global refining strategy is to own and operate strategically
advantaged refineries that benefit from vertical integration with our
marketing and trading operations, as well as horizontal integration with
other parts of the group’s business. Refining’s focus is to maintain and
improve its competitive position through sustainable, safe, reliable and
efficient operations of the refining system and disciplined investment
for integrity management, to achieve competitively advantaged
configuration and growth.
For BP, the strategic advantage of a refinery relates to its location,
scale and configuration to produce fuels from lower-cost feedstocks in
line with the demand of the region. Strategic investments in our
refineries are focused on securing the safety and reliability of our assets
while improving our competitive position. In addition, we continue to
invest to develop the capability to produce the cleaner fuels that meet
the requirements of our customers and their communities.
32