Avnet 2006 Annual Report Download - page 21
Download and view the complete annual report
Please find page 21 of the 2006 Avnet annual report below. You can navigate through the pages in the report by either clicking on the pages listed below, or by using the keyword search tool below to find specific information within the annual report.-
 1
1 -
2
-
3
-
4
-
5
-
6
-
7
-
8
-
9
-
10
-
 11
11 -
 12
12 -
 13
13 -
 14
14 -
 15
15 -
 16
16 -
 17
17 -
 18
18 -
 19
19 -
 20
20 -
 21
21 -
 22
22 -
 23
23 -
 24
24 -
 25
25 -
 26
26 -
 27
27 -
 28
28 -
 29
29 -
 30
30 -
 31
31 -
32
-
33
-
34
-
35
-
36
-
37
-
38
-
39
-
40
-
41
-
42
-
43
-
44
-
45
-
46
-
47
-
48
-
49
-
50
-
51
-
52
-
53
-
54
-
55
-
56
-
57
-
58
-
59
-
60
-
61
-
62
-
63
-
64
-
65
-
66
-
67
-
68
-
69
-
70
-
71
-
72
-
73
-
74
-
75
-
76
-
77
-
78
-
79
-
80
-
81
-
82
-
83
-
84
-
85
-
86
-
87
-
88
-
89
-
90
-
91
-
92
-
93
-
94
-
95
-
96
-
97
-
98
 |
 |

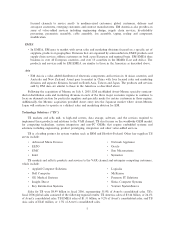
Years Ended
July 1, July 2, July 3, June 27, June 28,
2006 2005 2004 2003 2002
(Millions, except for per share and ratio data)
Financial Position:
Working capital ÏÏÏÏÏÏÏÏÏ 2,029.1 2,065.4 1,839.0 1,820.0 1,928.7
Total assets ÏÏÏÏÏÏÏÏÏÏÏÏÏ 6,215.7 5,098.2 4,863.7 4,500.0 4,682.0
Long-term debt ÏÏÏÏÏÏÏÏÏ 918.8 1,183.2 1,196.2 1,278.4 1,565.8
Shareholders' equityÏÏÏÏÏÏ 2,831.2 2,097.0 1,953.4 1,832.5 1,804.5
Per Share:
Basic earnings (loss) ÏÏÏÏÏ 1.40(a) 1.39 0.61(b) (0.39)(c) (0.71)(d)(e)
Diluted earnings (loss) ÏÏÏ 1.39(a) 1.39 0.60(b) (0.39)(c) (0.71)(d)(e)
Dividends ÏÏÏÏÏÏÏÏÏÏÏÏÏÏ Ì Ì Ì Ì 0.15
Book value ÏÏÏÏÏÏÏÏÏÏÏÏÏ 19.30 17.36 16.21 15.33 15.11
Ratios:
Operating income margin
on sales ÏÏÏÏÏÏÏÏÏÏÏÏÏÏ 3.0%(a) 2.9% 2.0%(b) 0.1%(c) Ì%(d)
Profit (loss) margin on
sales ÏÏÏÏÏÏÏÏÏÏÏÏÏÏÏÏÏ 1.4%(a) 1.5% 0.7%(b) (0.5)%(c) (0.9)%(d)(e)
Return on equity ÏÏÏÏÏÏÏÏ 7.8%(a) 8.1% 3.9%(b) (2.6)%(c) (4.1)%(d)(e)
Return on capital ÏÏÏÏÏÏÏÏ 7.6%(a) 7.5% 5.1%(b) 0.2%(c) (0.1)%(d)(e)
QuickÏÏÏÏÏÏÏÏÏÏÏÏÏÏÏÏÏÏ 1.1:1 1.5:1 1.3:1 1.4:1 1.2:1
Working capital ÏÏÏÏÏÏÏÏÏ 1.8:1 2.2:1 2.1:1 2.4:1 2.5:1
Total debt to capital ÏÏÏÏÏ 30.4% 37.2% 41.0% 44.4% 47.4%
(a) Includes the impact of restructuring, integration and other charges recorded during fiscal 2006, including
inventory writedowns for terminated lines (recorded in cost of sales), resulting from the Company's
acquisition and integration of Memec into Avnet's existing business and actions taken following the
divestitures of two TS businesses in the Americas, certain cost-cutting initiatives in the TS EMEA region
and other actions. These combined charges amounted to $69.9 million pre-tax (including $9.0 million
recorded in cost of sales), $49.9 million after tax and $0.34 per share on a diluted basis. Fiscal 2006
results also include incremental stock-based compensation expense resulting from the Company's
adoption of the Financial Accounting Standards Board's (""FASB'') Statement of Financial Accounting
Standard (""SFAS'') 123R, Share-based Payments (""SFAS 123R''), and modifications to stock-based
compensation plans in fiscal 2006. The incremental charges amounted to $16.6 million pre-tax,
$10.6 million after tax, and $0.07 per share on a diluted basis. The Company also incurred incremental
amortization expense associated with amortizable intangible assets recorded in fiscal 2006 as a result of
the Memec acquisition which amounted to $4.2 million pre-tax, $2.7 million after tax and $0.02 per share
on a diluted basis. Fiscal 2006 results also include a loss on the sale of business lines consisting of a loss on
the sale of two small, non-core EM businesses in the EMEA region recorded in the fourth quarter for
which no tax benefit was available, partially offset by a gain on sale of the TS single tier businesses in the
Americas recorded in the third quarter. The net loss on sale of businesses recorded in fiscal 2006
amounted to $2.6 million pre-tax, $7.1 million after tax and $0.05 per share on a diluted basis. In
addition, the fiscal 2006 results include debt extinguishment costs associated with the early repurchase of
$254.1 million of the Company's 8% Notes due November 15, 2006 in the first quarter and the early
repurchase of $113.6 million of the Company's 9
3
/
4
% Notes due February 15, 2008 in the fourth quarter.
The debt extinguishment costs amounted to $22.6 million pre-tax, $13.6 million after tax and $0.09 per
share on a diluted basis. The total impact of these charges recorded in fiscal 2006 amounted to
$115.9 million pre-tax, $83.9 million after tax and $0.57 per share on a diluted basis.
15