Avnet 2001 Annual Report Download - page 3
Download and view the complete annual report
Please find page 3 of the 2001 Avnet annual report below. You can navigate through the pages in the report by either clicking on the pages listed below, or by using the keyword search tool below to find specific information within the annual report.-
 1
1 -
 2
2 -
 3
3 -
 4
4 -
 5
5 -
 6
6 -
 7
7 -
 8
8 -
 9
9 -
 10
10 -
 11
11 -
 12
12 -
 13
13 -
 14
14 -
15
-
16
-
17
-
18
-
19
-
20
-
21
-
22
-
23
-
24
-
25
-
26
-
27
-
28
-
29
-
30
-
31
-
32
-
33
-
34
-
35
-
36
-
37
-
38
-
39
-
40
-
41
-
42
-
43
-
44
-
45
-
46
-
47
-
48
-
49
-
50
-
51
-
52
-
53
-
54
-
55
-
56
-
57
-
58
-
59
-
60
-
61
-
62
-
63
-
64
 |
 |

1
* Income amounts are from continuing operations and net assets from discontinued operations have been classified as current assets.
All amounts have been restated for the acquisition of Kent Electronics corporation which has been accounted for using the
“pooling-of-interests” method.
(a) Includes the net negative impact of $14.9 pre-tax and $12.5 after-tax ($0.12 per share on a diluted basis) for (i) the gain on the
sale of Channel Master of $33.8 pre-tax and $17.2 after-tax, (ii) costs relating to the divestiture of Avnet Industrial, the closure
of the Company’s corporate headquarters in Great Neck, New York, and the anticipated loss on the sale of Company-owned real
estate, amounting to $13.3 pre-tax and $8.5 after-tax, and (iii) incremental special charges associated with the reorganization of
EM, amounting to $35.4 pre-tax and $21.2 after-tax.
(b) Includes the net gain on exiting the printed catalog business recorded in the fourth quarter of 1999 offset by special charges
recorded in the first quarter associated with the reorganization of EM. The net positive effect on 1999 pre-tax income, net income
and diluted earnings per share were $183.0, $64.0, and $0.64, respectively.
(c) Includes special charges associated with: (i) the integration of Marshall Industries, Eurotronics B.V. (SEI) and the SEI Macro
Group into EM, (ii) the integration of JBA Computer Solutions into CM North America, (iii) the reorganization of EM Asia,
(iv) the reorganization of EM’s European operations including costs related to the consolidation of EM’s European warehousing
operations and (v) costs incurred in connection with certain litigation brought by the Company. The total special charges for
2000 amounted to $49.0 pre-tax, $30.4 after-tax and $0.28 per share on a diluted basis.
(d) Includes the impact of incremental special charges related to the acquisition and integration of Kent Electronics, which was
accounted for as a “pooling-of-interests,” and other integration, restructuring and cost cutting initiatives taken in response to current
business conditions. The special charges amounted to $327.5 pre-tax ($80.6 included in cost of sales and $246.9 included in operating
expenses) and $236.7 after-tax, or $1.99 per share on a diluted basis for the year ($2.01 per share for the fourth quarter).
(e) All per share data have been restated to reflect a two-for-one split of the Company’s common stock approved by the Board of Directors
on August 31, 2000. These shares were distributed on September 28, 2000 to shareholders of record on September 18, 2000.
financial
review
financial
review
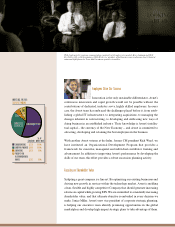
5.47
96 97 98 99 00 01
5.73
6.33
6.81
9.92
12.81
AVNET, INC.
SALES
1.77
96 97 98 99 00 01
1.74
1.71
1.22
1.78
1.99
AVNET, INC.
DILUTED EARNINGS PER SHARE
*Before special items described in notes (A-O)
2001 2000 1999 1998 1997 1996
(In millions, except for per share and ratio data)
I
NCOME
:
Sales $12,814.0 $9,915.0 $6,805.7 $6,334.6 $5,729.7 $5,469.3
Gross profit 1,865.5
(d)
1,444.8
(c)
1,048.0
(b)
1,081.1
(a)
1,042.1 1,030.8
Operating income 253.7
(d)
368.0
(c)
182.5
(b)
293.5
(a)
338.6 354.8
Income taxes 87.2
(d)
121.1
(c)
204.8
(b)
125.6
(a)
136.6 140.6
Earnings 0.1
(d)
162.6
(c)
180.3
(b)
165.9
(a)
191.3 193.4
F
INANCIAL
P
OSITION
:
Working capital 1,177.4 2,368.7 1,977.0 1,899.1 1,521.4 1,491.5
Total assets 5,864.1 5,934.4 3,563.4 3,308.6 2,898.3 2,809.3
Total debt 2,221.6 2,153.9 998.5 1,017.9 514.6 508.5
Shareholders’ equity 2,374.6 2,246.7 1,718.8 1,628.5 1,764.6 1,736.2
P
ER
S
HARE
(e)
:
Basic earnings —
(d)
1.52
(c)
1.89
(b)
1.63
(a)
1.78 1.81
Diluted earnings —
(d)
1.50
(c)
1.86
(b)
1.59
(a)
1.74 1.77
Dividends .30 .30 .30 .30 .30 .30
Book value 20.15 19.88 18.15 16.86 16.80 16.27
R
ATIOS
:
Operating income
margin on sales 2.0%
(d)
3.7%
(c)
2.7%
(b)
4.6%
(a)
5.9% 6.6%
Profit margin on sales —
(d)
1.6%
(c)
2.6%
(b)
2.6%
(a)
3.3% 3.6%
Return on equity —
(d)
8.1%
(c)
11.0%
(b)
9.5%
(a)
10.8% 11.8%
Return on capital 2.2%
(d)
6.1%
(c)
8.1%
(b)
7.7%
(a)
9.4% 10.0%
Quick .7:1 1.1:1 1.8:1 1.9:1 1.5:1 1.7:1
Working capital 1.5:1 2.2:1 3.3:1 3.9:1 3.5:1 3.6:1
Total debt to capital 48.3% 48.9% 36.8% 38.5% 22.6% 22.7%
IN BILLIONS