Atari 2010 Annual Report Download - page 17
Download and view the complete annual report
Please find page 17 of the 2010 Atari annual report below. You can navigate through the pages in the report by either clicking on the pages listed below, or by using the keyword search tool below to find specific information within the annual report.-
 1
1 -
2
-
3
-
4
-
5
-
6
-
 7
7 -
 8
8 -
 9
9 -
 10
10 -
 11
11 -
 12
12 -
 13
13 -
 14
14 -
 15
15 -
 16
16 -
 17
17 -
 18
18 -
 19
19 -
 20
20 -
 21
21 -
 22
22 -
 23
23 -
 24
24 -
 25
25 -
 26
26 -
 27
27 -
28
-
29
-
30
-
31
-
32
-
33
-
34
-
35
-
36
-
37
-
38
-
39
-
40
-
41
-
42
-
43
-
44
-
45
-
46
-
47
-
48
-
49
-
50
-
51
-
52
-
53
-
54
-
55
-
56
-
57
-
58
-
59
-
60
-
61
-
62
-
63
-
64
-
65
-
66
-
67
-
68
-
69
-
70
-
71
-
72
-
73
-
74
-
75
-
76
-
77
-
78
-
79
-
80
-
81
-
82
-
83
-
84
-
85
-
86
-
87
-
88
-
89
-
90
-
91
-
92
-
93
-
94
-
95
-
96
-
97
-
98
-
99
-
100
-
101
-
102
-
103
-
104
-
105
-
106
-
107
-
108
-
109
-
110
-
111
-
112
-
113
-
114
-
115
-
116
-
117
-
118
-
119
-
120
-
121
-
122
-
123
-
124
-
125
-
126
-
127
-
128
-
129
-
130
-
131
-
132
-
133
-
134
-
135
-
136
-
137
-
138
-
139
-
140
-
141
-
142
-
143
-
144
-
145
-
146
-
147
-
148
-
149
-
150
-
151
-
152
-
153
-
154
-
155
-
156
-
157
-
158
-
159
-
160
-
161
-
162
-
163
-
164
-
165
-
166
-
167
-
168
-
169
-
170
-
171
-
172
-
173
-
174
-
175
-
176
-
177
-
178
-
179
-
180
-
181
-
182
-
183
-
184
-
185
-
186
-
187
-
188
 |
 |

ANNUAL FINANCIAL REPORT – REGISTRATION DOCUMENT
17
INFORMATION ON MANAGEMENT AND THE FINANCIAL STATEMENTS
Year ended March 31, 2010
BOARD OF DIRECTORS’ REPORT ON THE GROUP’S MANAGEMENT
1. ECONOMIC ENVIRONMENT AND HIGHLIGHTS OF THE YEAR
1.1. ECONOMIC ENVIRONMENT
Atari (“the Company" or “the Group”) is one of the world's famous developers and publishers of interactive game
software. Most of its revenue is generated by sales in North America and Europe, where the trends observed in 2009 are
described below.
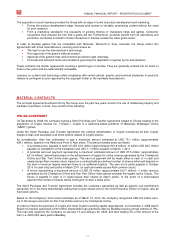
Global market overview (Source: IDG – January 2010)
North America and European market Revenues
in USD bn 2009 2010 Change
Console hardware 10,4
7,8
-25,0%
Handheld hardware 4,5
3,7
-17,8%
TOTAL hardware 14,9
11,5
-22,8%
Console software 15,3
14
-8,5%
Handheld and PC software 5,7
5,4
-5,3%
Total software 21
19,4
-7,6%
Mobile 4,6
6,5
41,3%
GLOBAL MARKET 49,4
50,8
2,8%
Europe and North America (Source: IDG – January 2010)
IDG estimates that Europe and North America market (including, hardware, software, Online and Mobile) raised USD
49.4 billion in 2009. New market opportunities raised in 2009 across multiple formats and distribution channels. In 2009,
mobile game revenues represented 9.3% of total revenues (or USD 4.6 billion) and online revenues represented 18.0%
of total revenues (or USD 8.9 billion).
According to IDG, while global game market (hardware, software, Online and mobile) should increase by 2.8% to USD
50.8 billion, traditional software market should decline by 7.6% while online market is expected to increase by 50.6% and
mobile game market is expected to increase by 41.3%.
North America (Source: IDG – January 2010)
IDG's research suggests that in 2009, software sales for consoles and handheld platforms in the United States declined
10% in value compared to 2008. Unit volumes lagged. These trends can be explained by pronounced softness in
demand and also increasing consumer price sensitivity.
IDG estimates that new market opportunities raised in 2009 across multiple formats and distribution channels. As per
IDG, global North America game market (software, hardware, online and mobile) represented USD 24.6 billion, out of
which mobile game revenues represented 8.9% of total revenues (or USD 2.2 billion) and online revenues represented
19.1% of total revenues (or USD4.7 billion).
According to IDG, while global game market (software, hardware, online and mobile) should increase by 4.5% to USD
25.7 billion, traditional software market should decline by 3.8% while online market is expected to increase by 51.1% and
mobile game market is expected to increase by 40.9%.
Europe (Source: IDG – January 2010)
IDG's research suggests that in 2009, software sales for consoles and handheld platforms in the United States declined
14% in value compared to 2008, due to difficult consumer spending environment, shift by some consumer to digital
distribution, pressure on prices as well as piracy. IDG estimates that new market opportunities raised in 2009 across
multiple formats and distribution channels as in North America.