Assurant 2005 Annual Report Download - page 9
Download and view the complete annual report
Please find page 9 of the 2005 Assurant annual report below. You can navigate through the pages in the report by either clicking on the pages listed below, or by using the keyword search tool below to find specific information within the annual report.-
 1
1 -
 2
2 -
 3
3 -
 4
4 -
 5
5 -
 6
6 -
 7
7 -
 8
8 -
 9
9 -
 10
10 -
 11
11 -
 12
12 -
 13
13 -
 14
14 -
 15
15 -
 16
16 -
 17
17 -
 18
18 -
 19
19 -
 20
20 -
21
-
22
-
23
-
24
-
25
-
26
-
27
-
28
-
29
-
30
-
31
-
32
-
33
-
34
-
35
-
36
-
37
-
38
-
39
-
40
-
41
-
42
-
43
-
44
-
45
-
46
-
47
-
48
-
49
-
50
-
51
-
52
-
53
-
54
-
55
-
56
-
57
-
58
-
59
-
60
-
61
-
62
-
63
-
64
-
65
 |
 |

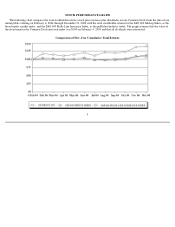
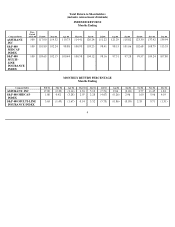
STOCK PERFORMANCE GRAPH
The following chart compares the total stockholder returns (stock price increase plus dividends) on our Common Stock from the date of our
initial public offering on February 4, 2004 through December 31, 2004 with the total stockholder returns for the S&P 400 Midcap Index, as the
broad equity market index, and the S&P 400 Multi-Line Insurance Index, as the published industry index. The graph assumes that the value of
the investment in the Common Stock and each index was $100 on February 4, 2004 and that all dividends were reinvested.
Comparison of Five-Year Cumulative Total Returns
3