Ameriprise 2012 Annual Report Download - page 11
Download and view the complete annual report
Please find page 11 of the 2012 Ameriprise annual report below. You can navigate through the pages in the report by either clicking on the pages listed below, or by using the keyword search tool below to find specific information within the annual report.-
 1
1 -
 2
2 -
 3
3 -
 4
4 -
 5
5 -
 6
6 -
 7
7 -
 8
8 -
 9
9 -
 10
10 -
 11
11 -
 12
12 -
 13
13 -
 14
14 -
 15
15 -
 16
16 -
 17
17 -
 18
18 -
 19
19 -
 20
20 -
 21
21 -
 22
22 -
23
-
24
-
25
-
26
-
27
-
28
-
29
-
30
-
31
-
32
-
33
-
34
-
35
-
36
-
37
-
38
-
39
-
40
-
41
-
42
-
43
-
44
-
45
-
46
-
47
-
48
-
49
-
50
-
51
-
52
-
53
-
54
-
55
-
56
-
57
-
58
-
59
-
60
-
61
-
62
-
63
-
64
-
65
-
66
-
67
-
68
-
69
-
70
-
71
-
72
-
73
-
74
-
75
-
76
-
77
-
78
-
79
-
80
-
81
-
82
-
83
-
84
-
85
-
86
-
87
-
88
-
89
-
90
-
91
-
92
-
93
-
94
-
95
-
96
-
97
-
98
-
99
-
100
-
101
-
102
-
103
-
104
-
105
-
106
-
107
-
108
-
109
-
110
-
111
-
112
-
113
-
114
-
115
-
116
-
117
-
118
-
119
-
120
-
121
-
122
-
123
-
124
-
125
-
126
-
127
-
128
-
129
-
130
-
131
-
132
-
133
-
134
-
135
-
136
-
137
-
138
-
139
-
140
-
141
-
142
-
143
-
144
-
145
-
146
-
147
-
148
-
149
-
150
-
151
-
152
-
153
-
154
-
155
-
156
-
157
-
158
-
159
-
160
-
161
-
162
-
163
-
164
-
165
-
166
-
167
-
168
-
169
-
170
-
171
-
172
-
173
-
174
-
175
-
176
-
177
-
178
-
179
-
180
-
181
-
182
-
183
-
184
-
185
-
186
-
187
-
188
-
189
-
190
-
191
-
192
-
193
-
194
-
195
-
196
-
197
-
198
-
199
-
200
-
201
-
202
-
203
-
204
-
205
-
206
 |
 |

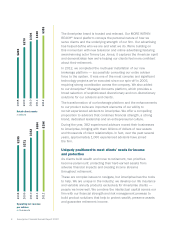
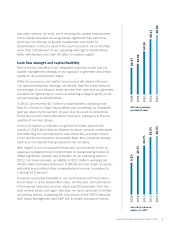
9.2%
10.7%
13.7%
16.0%
16.2%
Operating return on
equity, ex. AOCI
2008
2009
2010
2011
2012
Operating earnings
per diluted share
2008
2009
2010
2011
2012
$2.57
$2.95
$4.10
$5.17
$5.59
Ameriprise Financial Annual Report 2012 9
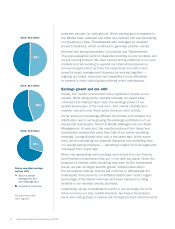
and other actions. As such, we’re lowering the capital requirements
of the overall business as we generate signicant free cash ow,
which we can allocate to growth investments and return to
shareholders. In fact, in each of the past two years, we’ve returned
more than 130 percent of our operating earnings to shareholders
while maintaining more than $2 billion in excess capital.
Cash flow strength and capital flexibility
One of the key benets of our integrated business model and our
capital management strategy is our capacity to generate and deploy
capital to drive shareholder value.
While the economic and market environment will always inuence
our capital deployment strategy, we believe that the combination of
the strength of our balance sheet and the free cash ow we generate
provides the opportunity to continue returning a large majority of our
annual earnings to shareholders.
In 2012, we returned $1.7 billion to shareholders, devoting more
than $1.3 billion to share repurchases and increasing our dividends
paid per share by 64 percent. At year end, the yield on Ameriprise
Financial common stock was about 3 percent, putting us in the top
quartile of our peer group.
In fact, we expect to maintain a high level of share repurchase
activity in 2013 given that we believe our stock remains undervalued
and reecting our commitment to help offset the per-share impact
of our decision to transition Ameriprise Bank from a federal savings
bank to a non-deposit taking national trust company.
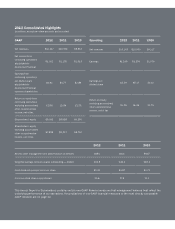
With regard to our consolidated nancials, our continued focus on
expense management and commitment to reengineering helped to
offset signicant interest rate pressure. On an operating basis in
2012, net revenues were up slightly to $10.1 billion, earnings per
diluted share increased 8 percent to $5.59, and our return on equity,
excluding accumulated other comprehensive income, increased to
a strong 16.2 percent.
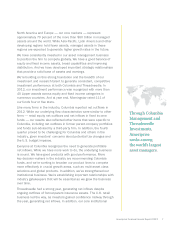
Investors responded favorably to our performance and the actions
we’ve taken to drive shareholder value. For the year, the total return
of Ameriprise Financial common stock was 29.5 percent. Over the
past several years, and again this year, we have continued to deliver
compelling returns, outpacing the total return of the S&P Financials,
S&P Asset Management and S&P Life & Health Insurance indices.