Ameriprise 2012 Annual Report Download - page 10
Download and view the complete annual report
Please find page 10 of the 2012 Ameriprise annual report below. You can navigate through the pages in the report by either clicking on the pages listed below, or by using the keyword search tool below to find specific information within the annual report.-
 1
1 -
 2
2 -
 3
3 -
 4
4 -
 5
5 -
 6
6 -
 7
7 -
 8
8 -
 9
9 -
 10
10 -
 11
11 -
 12
12 -
 13
13 -
 14
14 -
 15
15 -
 16
16 -
 17
17 -
 18
18 -
 19
19 -
 20
20 -
 21
21 -
22
-
23
-
24
-
25
-
26
-
27
-
28
-
29
-
30
-
31
-
32
-
33
-
34
-
35
-
36
-
37
-
38
-
39
-
40
-
41
-
42
-
43
-
44
-
45
-
46
-
47
-
48
-
49
-
50
-
51
-
52
-
53
-
54
-
55
-
56
-
57
-
58
-
59
-
60
-
61
-
62
-
63
-
64
-
65
-
66
-
67
-
68
-
69
-
70
-
71
-
72
-
73
-
74
-
75
-
76
-
77
-
78
-
79
-
80
-
81
-
82
-
83
-
84
-
85
-
86
-
87
-
88
-
89
-
90
-
91
-
92
-
93
-
94
-
95
-
96
-
97
-
98
-
99
-
100
-
101
-
102
-
103
-
104
-
105
-
106
-
107
-
108
-
109
-
110
-
111
-
112
-
113
-
114
-
115
-
116
-
117
-
118
-
119
-
120
-
121
-
122
-
123
-
124
-
125
-
126
-
127
-
128
-
129
-
130
-
131
-
132
-
133
-
134
-
135
-
136
-
137
-
138
-
139
-
140
-
141
-
142
-
143
-
144
-
145
-
146
-
147
-
148
-
149
-
150
-
151
-
152
-
153
-
154
-
155
-
156
-
157
-
158
-
159
-
160
-
161
-
162
-
163
-
164
-
165
-
166
-
167
-
168
-
169
-
170
-
171
-
172
-
173
-
174
-
175
-
176
-
177
-
178
-
179
-
180
-
181
-
182
-
183
-
184
-
185
-
186
-
187
-
188
-
189
-
190
-
191
-
192
-
193
-
194
-
195
-
196
-
197
-
198
-
199
-
200
-
201
-
202
-
203
-
204
-
205
-
206
 |
 |

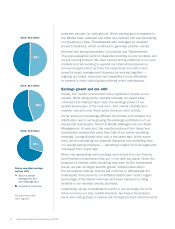
2008: $0.9 billion
30%
2010: $1.6 billion
45%
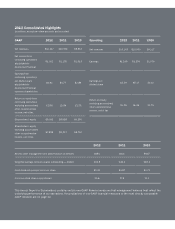
Pretax operating earnings
and mix shift
Advice & Wealth
Management and
Asset Management
Annuities & Protection
(Excludes Corporate &
Other segment)
2012: $2.0 billion
51%
8 Ameriprise Financial Annual Report 2012
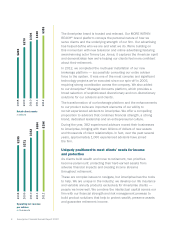
business remains on solid ground. We’re earning good mandates in
the Middle East, Australia and other key markets and are developing
our presence in Asia. Threadneedle also manages an excellent
property business, which continues to generate positive results.
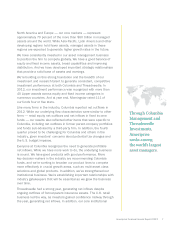
We have two strong franchises in Columbia and Threadneedle.
The post-acquisition work to integrate Columbia is now complete and
we are moving forward. We have earned strong positions in our core
markets and are working to expand our international presence.
And we recognize that we have the opportunity to build a more
powerful asset management business by working together —
aligning our talent, resources and capabilities more effectively
to present a more unied global offering to the marketplace.
Earnings growth and mix shift
Clearly, the market environment has a signicant impact on our
results. While rising equity markets increase our asset base,
continued low interest rates mute the earnings power of our
spread businesses in the near term. And market volatility and
investor concerns over scal policy dampen client activity.
As we serve an increasingly afuent client base and broaden our
distribution reach, we’re growing the earnings contribution of our
key growth businesses: Advice & Wealth Management and Asset
Management. At year end, the results produced from these two
businesses represented more than half of our pretax operating
earnings, up signicantly from only a few years ago. At the same
time, we’re maintaining our expense discipline and beneting from
our reengineering initiatives — operating margins for both segments
increased from a year ago.
We’re also generating solid earnings and returns from our Annuity
and Protection businesses that are in line with our plans. Given the
prospect of interest rates remaining near zero for the foreseeable
future, we plan to target specic growth opportunities within
the Ameriprise channel. And we will continue to differentiate the
businesses from peers by our afliated distribution model, higher
percentage of fee-based revenues and lower exposure to living
benets in our variable annuity business.
Importantly, as we orchestrate this shift in our earnings mix to be
driven more by our less capital-intensive, fee-based businesses,
we’re also taking steps to reduce risk through product enhancements