Airtran 2007 Annual Report Download - page 9
Download and view the complete annual report
Please find page 9 of the 2007 Airtran annual report below. You can navigate through the pages in the report by either clicking on the pages listed below, or by using the keyword search tool below to find specific information within the annual report.-
 1
1 -
 2
2 -
 3
3 -
 4
4 -
 5
5 -
 6
6 -
 7
7 -
 8
8 -
 9
9 -
 10
10 -
 11
11 -
 12
12 -
 13
13 -
 14
14 -
 15
15 -
 16
16 -
 17
17 -
 18
18 -
 19
19 -
 20
20 -
21
-
22
-
23
-
24
-
25
-
26
-
27
-
28
-
29
-
30
-
31
-
32
-
33
-
34
-
35
-
36
-
37
-
38
-
39
-
40
-
41
-
42
-
43
-
44
-
45
-
46
-
47
-
48
-
49
-
50
-
51
-
52
-
53
-
54
-
55
-
56
-
57
-
58
-
59
-
60
-
61
-
62
-
63
-
64
-
65
-
66
-
67
-
68
-
69
-
70
-
71
-
72
-
73
-
74
-
75
-
76
-
77
-
78
-
79
-
80
-
81
-
82
-
83
-
84
-
85
-
86
-
87
-
88
-
89
-
90
-
91
-
92
 |
 |

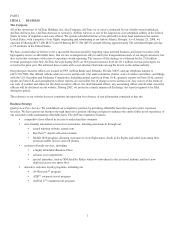
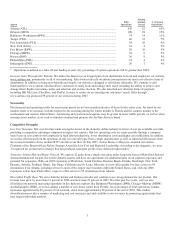
3
Airport
-
Daily
Operations*
Nonstop
Markets
Served
% of System
Operations*
Atlanta (ATL)...................................................................................................................... 436 52 65%
Orlando (MCO) ................................................................................................................... 100 29 15%
Baltimore-Washington (BWI) .............................................................................................. 74 14 11%
Tampa (TPA)....................................................................................................................... 46 12 7%
Fort Lauderdale (FLL) ......................................................................................................... 38 10 6%
New York (LGA)................................................................................................................. 32 4 5%
Fort Myers (RSW) ............................................................................................................... 30 10 5%
Chicago (MDW).................................................................................................................. 30 6 5%
Boston (BOS) ...................................................................................................................... 36 8 5%
Philadelphia (PHL) .............................................................................................................. 24 4 4%
Indianapolis (IND)............................................................................................................... 26 7 4%
* Operations is defined as a take-off and landing at each city; percentage of system operations will be greater than 100%
Increase Sales Through Our Website. We utilize the Internet as an integral part of our distribution network and emphasize our website,
www.airtran.com, prominently in all of our marketing. Sales booked directly on airtran.com represent our most cost-effective form of
distribution. In addition to being user-friendly and simple, our website is designed to sell tickets efficiently. We continue to add
functionality to www.airtran.com that allows customers to easily book and manage their travel including the ability to retrieve and
change future flight reservations, make seat selection and on-line check-in. We also launched new alternate forms of payment,
including Bill Me Later, Checkfree, and PayPal, in order to ensure we are meeting our customers’ needs. Sales through
www.airtran.com produced 59 percent of our revenues during 2007.
Seasonality
Our financial and operating results for any interim period are not necessarily indicative of those for the entire year. Air travel in our
markets tends to be seasonal, with the highest levels occurring during the winter months to Florida and the summer months to the
northeastern and western United States. Advertising and promotional expenses may be greater in lower traffic periods, as well as when
entering a new market, as we seek to stimulate demand and promote the AirTran Airways brand.
Competitive Strengths
Low Cost Structure. Our cost structure ranks among the lowest in the domestic airline industry in terms of cost per available seat mile,
providing a competitive advantage compared to higher cost carriers. Our low operating costs are made possible through a company-
wide focus on cost controls with emphasis on high labor productivity, lower distribution costs and higher asset utilization. In addition,
we realize efficiencies from the operation of only two aircraft types from a single manufacturer as well as enhanced efficiencies from
the increased number of new modern B737 aircraft in our fleet. In July 2007, Airline Business Magazine awarded our current
Chairman of the Board with an Airline Strategy Award for Low Cost and Regional Leadership. According to the magazine, we were
“recognized for an innovative strategy that has produced consistent profits in an extremely tight market.”
Attractive Atlanta Hub and Route Network. We operate 22 gates from a single concourse under long-term leases at Hartsfield-Jackson
Atlanta International Airport, the world’s busiest airport, and have use agreements for additional gates on an adjacent concourse and
potential for expansion. With our 2007 expansion to Charleston, South Carolina, Daytona Beach, Florida, Newburgh, New York,
Phoenix, Arizona, Portland, Maine, San Diego, California and St. Louis, Missouri, we now offer quality low fare service to 54
destinations from Atlanta, including service to most of the largest travel markets within the United States, and, with our 2008
expansion to San Juan, Puerto Rico, expect to offer service to 55 destinations from Atlanta.
Diversified Traffic Base. We serve both the leisure and business traveler and continue to see strong demand for our product. Our
revenue base grew by more than 31 percent in 2006 and more than 22 percent in 2007. Over the past five years, we have also
diversified our network increasing operations in key business markets like Baltimore/Washington (BWI), Chicago-Midway (MDW)
and Indianapolis (IND), as well as adding a number of new direct routes from Florida. As a percentage of total operations, Atlanta
represents approximately 65 percent of our network, down from approximately 90 percent at the end of 2001. This market
diversification provides a number of marketing and cost synergies and adds stability to our revenues by protecting against risks that
may impact individual markets.