Airtran 2000 Annual Report Download - page 22
Download and view the complete annual report
Please find page 22 of the 2000 Airtran annual report below. You can navigate through the pages in the report by either clicking on the pages listed below, or by using the keyword search tool below to find specific information within the annual report.-
 1
1 -
2
-
3
-
4
-
5
-
6
-
7
-
8
-
9
-
10
-
11
-
 12
12 -
 13
13 -
 14
14 -
 15
15 -
 16
16 -
 17
17 -
 18
18 -
 19
19 -
 20
20 -
 21
21 -
 22
22 -
 23
23 -
 24
24 -
 25
25 -
 26
26 -
 27
27 -
 28
28 -
 29
29 -
 30
30 -
 31
31 -
 32
32 -
33
-
34
-
35
-
36
-
37
-
38
-
39
-
40
-
41
-
42
-
43
-
44
-
45
-
46
-
47
-
48
-
49
-
50
-
51
-
52
 |
 |

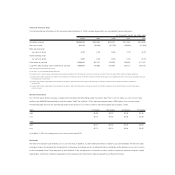
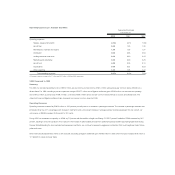
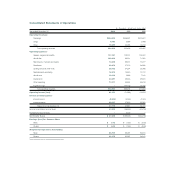
Results of Operations
We achieved record annual revenues, record passenger revenue per available seat mile (RASM), and served a record number of passengers during 2000.
This strong financial performance produced an operating profit of $81.2 million and an operating margin of 13 percent for the year, even though fuel expense
increased by more than 105 percent over 1999. Air travelers, particularly business travelers, continue to respond to our unique brand of low fares and quality
service as we expand into areas of the eastern United States that have traditionally been characterized by high fares.
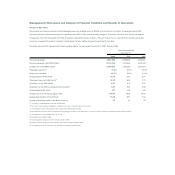
The tables below set forth selected financial and operating data for the years ended December 31, 2000, 1999 and 1998.
Twelve Months Ended
December 31,
2000 1999 1998
Revenue passengers 7,566,986 6,460,533 5,462,827
Revenue passenger miles (RPMs) (000s)(1) 4,115,745 3,473,490 3,244,539
Available seat miles (ASMs) (000s)(2) 5,859,395 5,467,556 5,442,234
Passenger load factor(3) 70.2% 63.5% 59.6%
Break-even load factor(4) 64.7% 59.4% 61.5%
Average yield per RPM (cents)(5) 14.70 14.01 12.97
Passenger revenue per ASM (cents)(6) 10.32 8.90 7.73
Operating cost per ASM (cents)(7) 9.27 8.19 7.91
Operating cost per ASM, excluding aircraft fuel (cents)(8) 6.87 6.94 6.59
Average stage length (miles) 537 528 546
Average cost of aircraft fuel per gallon (cents) 100.89 49.95 54.87
Average daily utilization (hours:minutes)(9) 10:18 9:54 9:42
Number of operating aircraft in fleet at end of period 53 47 50
(1) The number of scheduled revenue miles flown by passengers
(2) The number of seats available for passengers multiplied by the number of scheduled miles each seat is flown
(3) The percentage of aircraft seating capacity that is actually utilized (RPMs divided by ASMs)
(4) The percentage of seats that must be occupied by revenue passengers in order for us to break even on a pre-tax income basis, excluding nonrecurring items and impairment charges
(5) The average amount one passenger pays to fly one mile
(6) Passenger revenue divided by ASMs
(7) Operating expenses, excluding impairment charges, divided by ASMs
(8) Operating expenses, excluding aircraft fuel expense and impairment charges, divided by ASMs
(9) The average number of hours per day that an aircraft flown is operated in revenue service
Management’s Discussion and Analysis of Financial Condition and Results of Operations