Whole Foods 2015 Annual Report Download - page 9
Download and view the complete annual report
Please find page 9 of the 2015 Whole Foods annual report below. You can navigate through the pages in the report by either clicking on the pages listed below, or by using the keyword search tool below to find specific information within the annual report.-
 1
1 -
 2
2 -
 3
3 -
 4
4 -
 5
5 -
 6
6 -
 7
7 -
 8
8 -
 9
9 -
 10
10 -
 11
11 -
 12
12 -
 13
13 -
 14
14 -
 15
15 -
 16
16 -
 17
17 -
 18
18 -
 19
19 -
 20
20 -
21
-
22
-
23
-
24
-
25
-
26
-
27
-
28
-
29
-
30
-
31
-
32
-
33
-
34
-
35
-
36
-
37
-
38
 |
 |

5
Eco-Scale™
In 2011, we became the first national retailer to launch its own comprehensive set of green cleaning standards to help shoppers
make informed choices for their homes and the planet. Under our Eco-Scale rating system, all household cleaning products in
our stores are required to list all ingredients on their packaging, a labeling practice not currently required by the U.S. government.
This rating system allows shoppers to easily identify a product’s environmental impact and safety based on a red-orange-yellow-
green color scale. All brands in our stores must meet our minimum orange standard.
Growth Strategy
We are a Fortune 500 company, ranking number 214 on the 2015 list. Our sales have grown rapidly through strong comparable
store sales growth, acquisitions and new store openings from approximately $93 million in fiscal year 1991, excluding the effect
of pooling-of-interests transactions completed since 1991, to approximately $15.4 billion in fiscal year 2015, a 24-year
compounded annual growth rate of approximately 24%.
Our growth strategy is to expand primarily through new store openings, and while we may pursue acquisitions of smaller chains
that provide access to desirable geographic areas and experienced team members, such acquisitions are not expected to
significantly impact our future store growth or financial results. We have a disciplined, opportunistic real estate strategy, opening
stores in existing trade areas as well as new areas, including international locations. We typically target premium real estate
sites, and while new stores may be as small as 20,000 square feet or as large as 75,000 square feet, the majority fall in the range
of 35,000 to 45,000 square feet.
365 by Whole Foods Market™
In fiscal year 2015, we announced plans to launch a second store format, 365 by Whole Foods Market, which we believe expands
our growth opportunity to beyond 1,200 stores. The mission of 365 by Whole Foods Market is to bring fresh, healthy and
affordable food to more people in more places every day. As a second growth vehicle, we expect these stores to complement
the Whole Foods Market brand, allowing us to address the value-quality proposition in a new way – through a smaller footprint,
curated product selection, convenience and technology – while maintaining the integrity of our brand in the marketplace.
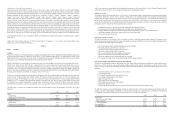
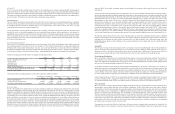
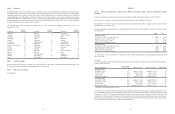
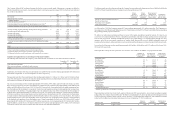
Our historical store growth for the fiscal years indicated is summarized below:
2015 2014 2013 2012 2011
Stores at beginning of fiscal year 399 362 335 311 299
Stores opened 38 34 26 25 18
Acquired stores — 4 6 — —
Relocated stores (6) (1) (5) (1) (6)
Stores at end of fiscal year 431 399 362 335 311
Total gross square footage at end of fiscal year 16,625,000 15,162,000 13,779,000 12,735,000 11,832,000
Year-over-year growth 9.7% 10.0% 8.2% 7.6% 5.3%
Our historical store development pipeline as of the dates indicated is summarized below:
November 4,
2015
November 5,
2014
November 6,
2013
November 7,
2012
November 2,
2011
Stores in development 111 114 94 79 62
Average size (gross square feet) 43,000 41,000 38,000 37,000 35,000
Total gross square footage in development 4,810,000 4,723,000 3,605,000 2,896,000 2,192,000
Store Description
We strive to transform food shopping from a chore into a dynamic experience by designing and operating stores with a lively,
inspirational atmosphere, mission-oriented décor and well-trained team members. We offer an exciting product mix that
emphasizes our high quality standards and healthy eating, with a range of choices at every price level, ever-changing selections,
samples, open kitchens, scratch bakeries, hand-stacked produce, bulk departments and extensive prepared foods stations featuring
wood-burning pizza ovens; burrito stations and ethnic foods; juicing and handcrafted coffee stations; and greens, beans and
grains cooking bars, among others. To meet our customers’ evolving needs and preferences, we carefully evaluate and balance
the blend between full- and self-service options. We also incorporate environmentally sustainable aspects into our store design,
and many stores have bicycle racks and electric vehicle charging stations. Our stores typically include sit-down eating areas and
customer service booths, and many stores offer special services such as personal shopping, online ordering and home delivery
through customer service or Instacart. Some stores also offer sit-down wine bars and tap rooms featuring local and/or craft beer
and wine, creating a destination for customer gathering. We believe our stores play a unique role as a third place, besides the
6
home and office, where people can gather, interact and learn while at the same time discovering the many joys of eating and
sharing food.
Our store development work starts early. We conscientiously work to serve our communities through volunteer work, partnerships,
and incorporating community feedback throughout the design process. By tailoring our store size, design, product selection and
pricing to the particular community, we have been able to move into more segments of the market – urban and suburban, domestic
and international. Most of our stores are located in high-traffic shopping areas on premier real estate sites and are either
freestanding or in strip centers. We also have a number of urban stores located in high-density, mixed-use developments. In
selecting store locations, we use an internally developed model to analyze potential sites based on various criteria such as
education levels, population density and income levels within certain drive times. After we have selected a target site, our
development group does a comprehensive site study and sales projection and works with our regional teams to develop
construction and operating cost estimates. Each project must meet an internal Economic Value Added (“EVA®”) hurdle return,
based on our internal weighted average cost of capital, which for new stores generally is expected to be cumulative positive
EVA in five years or less. In its simplest definition, EVA is equivalent to net operating profits after taxes minus a charge on the
cost of invested capital necessary to generate those profits. Our current internal weighted average cost of capital metric is 8%.
The required cash investment for new stores varies depending on the size of the store, geographic location, degree of landlord
incentives and complexity of site development issues. To a significant degree, it also depends on how the project is structured,
including costs for elements that often increase or decrease rent, e.g., lease acquisition costs, shell and/or garage costs, and
landlord allowances. Because of these differences, the average development cost per square foot may vary significantly from
project to project.
Seasonality
The Company’s average weekly sales and gross profit as a percentage of sales are typically highest in the second and third fiscal
quarters, and lowest in the fourth fiscal quarter due to seasonally slower sales during the summer months. Gross profit as a
percentage of sales is also lower in the first fiscal quarter due to the product mix of holiday sales. For this reason, results in a
quarter are not necessarily indicative of the results that may be achieved in other quarters or for the full fiscal year.
Purchasing and Distribution
We are committed to buying from local, regional and national producers who meet our high quality standards. The majority of
our purchasing occurs at the regional and national levels, enabling us to negotiate better discounts, innovate categories, and
improve the supply chain, while allowing our store buyers to focus on shelf replenishment, local products, and the unique product
mix necessary to keep the neighborhood market feel in our stores.
Our produce procurement center facilitates the procurement and distribution of the majority of the produce we sell. We also
operate three seafood processing and distribution facilities, a specialty coffee and tea procurement and roasting operation, and
11 regional distribution centers that focus primarily on perishables distribution to our stores across the U.S., Canada and the
U.K. In addition, we have three regional commissary kitchens and four bakehouse facilities, all of which distribute products to
our stores. Other products are typically procured through a combination of specialty wholesalers and direct distributors.
United Natural Foods, Inc. (“UNFI”) is our single largest third-party supplier, accounting for approximately 32.0% of our total
purchases in fiscal year 2015. Subsequent to fiscal year 2015, we entered into a distribution agreement which generally extends
our long-term relationship with UNFI as our primary supplier of dry grocery and frozen food products through 2025.
Store Operations
We strive to promote a strong company culture featuring a team approach to store operations that we believe is distinctly more
empowering to team members than that of the traditional supermarket. Whole Foods Market stores each employ between
approximately 55 and 650 team members who generally comprise 10 self-managed teams per store, each led by a team leader.
Each team within a store is responsible for a different product offering or aspect of store operations such as prepared foods,
grocery, or customer service, among others. We also promote a decentralized approach to store operations in which many
decisions are made by teams at the individual store level. In this structure, an effective store team leader is critical to the success
of the store. The store team leader works closely with one or more associate store team leaders, as well as with all of the department
team leaders, to operate the store as efficiently and profitably as possible. In addition, the rollout of a new labor scheduling tool,
which started in fiscal year 2015 with one of our largest teams (Customer Service), should be a valuable asset for managing
labor effectiveness across all of our stores in the future.
Team members are involved at all levels of our business. We strive to create a company-wide consciousness of “shared fate” by
uniting the interests of team members as closely as possible with those of our shareholders. One way we reinforce this concept