Whole Foods 2015 Annual Report Download - page 31
Download and view the complete annual report
Please find page 31 of the 2015 Whole Foods annual report below. You can navigate through the pages in the report by either clicking on the pages listed below, or by using the keyword search tool below to find specific information within the annual report.-
 1
1 -
2
-
3
-
4
-
5
-
6
-
7
-
8
-
9
-
10
-
11
-
12
-
13
-
14
-
15
-
16
-
17
-
18
-
19
-
20
-
 21
21 -
 22
22 -
 23
23 -
 24
24 -
 25
25 -
 26
26 -
 27
27 -
 28
28 -
 29
29 -
 30
30 -
 31
31 -
 32
32 -
 33
33 -
 34
34 -
 35
35 -
 36
36 -
 37
37 -
 38
38
 |
 |

49
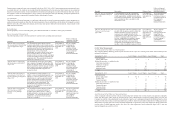
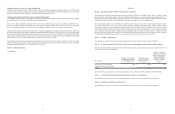
(11) Shareholders’ Equity
Common Stock
On September 15, 2015, the Company increased the number of authorized shares of the Company’s common stock from 600
million shares to 1.2 billion shares.
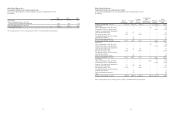
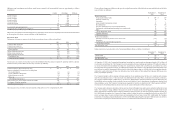
Dividends per Common Share
The following table provides a summary of dividends declared per common share during fiscal years 2015 and 2014 (in millions,
except per share amounts):
Date of declaration Dividend per
common share Date of record Date of payment Total amount
)LVFDO\HDU
November 5, 2014 $ 0.13 January 16, 2015 January 27, 2015 $ 47
March 10, 2015 0.13 April 10, 2015 April 21, 2015 47
June 9, 2015 0.13 July 2, 2015 July 14, 2015 47
September 15, 2015 (1) 0.13 October 2, 2015 October 13, 2015 45
)LVFDO\HDU
November 1, 2013 $ 0.12 January 17, 2014 January 28, 2014 $ 45
February 24, 2014 0.12 April 11, 2014 April 22, 2014 44
June 12, 2014 0.12 July 3, 2014 July 15, 2014 44
September 11, 2014 0.12 September 26, 2014 October 7, 2014 43
(1) Dividend accrued at September 27, 2015
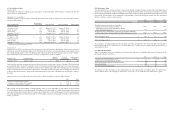
Treasury Stock
During fiscal year 2014, a new share repurchase program was authorized pursuant to the authority of the Company’s Board of
Directors whereby the Company may make up to $1.0 billion in stock purchases of outstanding shares of the common stock of
the Company through August 1, 2016. The following table outlines the share repurchase program authorized by the Company’s
Board of Directors, and the related repurchase activity as of September 27, 2015 (in millions):
Effective date Expiration date Amount
authorized
Cost of
repurchases
Authorization
available
August 1, 2014 August 1, 2016 $ 1,000 $ 613 $ 387
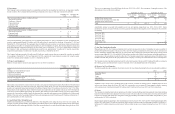
Under the share repurchase program, purchases can be made from time to time using a variety of methods, which may include
open market purchases. The specific timing, price and size of purchases will depend on prevailing stock prices, general economic
and market conditions, and other considerations. Purchases may be made through a Rule 10b5-1 plan pursuant to pre-determined
metrics set forth in such plan. The Board’s authorization of the share repurchase program does not obligate the Company to
acquire any particular amount of common stock, and the program may be suspended or discontinued at any time at the Company’s
discretion.
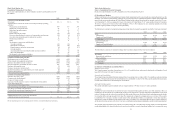
Share repurchase activity for the fiscal years indicated was as follows (in millions, except per share amounts):
2015 2014
Number of common shares acquired 13.8 13.9
Average price per common share acquired $ 37.06 $ 41.51
Total cost of common shares acquired $ 513 $ 578
The Company reissued approximately 2.3 million treasury shares at cost of approximately $100 million and approximately
0.5 million treasury shares at cost of approximately $20 million to satisfy the issuance of common stock pursuant to team member
stock plans during fiscal years 2015 and 2014, respectively. At September 27, 2015 and September 28, 2014, the Company held
in treasury approximately 28.2 million shares and 16.7 million shares, respectively, totaling approximately $1.1 billion and $711
million, respectively.
50
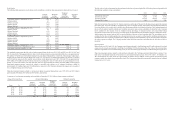
(12) Earnings per Share
The computation of basic earnings per share is based on the number of weighted average common shares outstanding during
the period. The computation of diluted earnings per share includes the dilutive effect of common stock equivalents consisting
of incremental common shares deemed outstanding from the assumed exercise of stock options and the dilutive effect of restricted
stock awards. A reconciliation of the numerators and denominators of the basic and diluted earnings per share calculations
follows (in millions, except per share amounts):
2015 2014 2013
Net income (numerator for basic and diluted earnings per share) $ 536 $ 579 $ 551
Weighted average common shares outstanding
(denominator for basic earnings per share) 358.5 367.8 371.2
Incremental common shares attributable to dilutive
effect of share-based awards 2.3 2.7 3.3
Weighted average common shares outstanding and potential additional
common shares outstanding(denominator for diluted earnings per share) 360.8 370.5 374.5
Basic earnings per share $ 1.49 $ 1.57 $ 1.48
Diluted earnings per share $ 1.48 $ 1.56 $ 1.47
The computation of diluted earnings per share for fiscal years 2015, 2014 and 2013 does not include share-based awards to
purchase approximately 12.0 million shares, 9.1 million shares and 7.1 million shares of common stock, respectively, due to
their antidilutive effect.
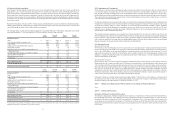
(13) Share-Based Payments
Share-based payment expense was included in the following line items on the Consolidated Statements of Operations for the
fiscal years indicated (in millions):
2015 2014 2013
Cost of goods sold and occupancy costs $ 2 $ 2 $ 2
Selling, general and administrative expenses 62 66 55
Share-based payment expense before income taxes 64 68 57
Income tax benefit (25) (26) (22)
Net share-based payment expense $ 39 $ 42 $ 35
At September 27, 2015, September 28, 2014 and September 29, 2013 approximately 32.9 million shares, 37.6 million shares
and 42.3 million shares of the Company’s common stock, respectively, were available for future stock incentive grants.