Whole Foods 2015 Annual Report Download - page 25
Download and view the complete annual report
Please find page 25 of the 2015 Whole Foods annual report below. You can navigate through the pages in the report by either clicking on the pages listed below, or by using the keyword search tool below to find specific information within the annual report.-
 1
1 -
2
-
3
-
4
-
5
-
6
-
7
-
8
-
9
-
10
-
11
-
12
-
13
-
14
-
 15
15 -
 16
16 -
 17
17 -
 18
18 -
 19
19 -
 20
20 -
 21
21 -
 22
22 -
 23
23 -
 24
24 -
 25
25 -
 26
26 -
 27
27 -
 28
28 -
 29
29 -
 30
30 -
 31
31 -
 32
32 -
 33
33 -
 34
34 -
 35
35 -
36
-
37
-
38
 |
 |

37
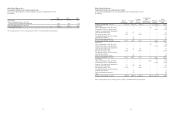
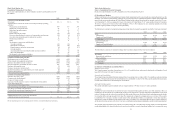
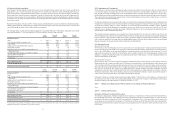
Whole Foods Market, Inc.
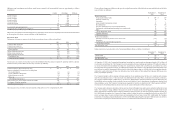
Consolidated Statements of Cash Flows
Fiscal years ended September 27, 2015, September 28, 2014 and September 29, 2013
(In millions)
2015 2014 2013
Cash flows from operating activities
Net income $ 536 $ 579 $ 551
Adjustments to reconcile net income to net cash provided by operating
activities:
Depreciation and amortization 439 377 339
Impairment of long-lived assets 48 1 1
Share-based payment expense 64 68 57
LIFO expense 1 16 2
Deferred income tax benefit (43) (78) (51)
Excess tax benefit related to exercise of team member stock options (11) (9) (37)
Accretion of premium/discount on marketable securities 17 27 31
Deferred lease liabilities 32 36 51
Other 5 11 8
Net change in current assets and liabilities:
Accounts receivable (21) (14) 9
Merchandise inventories (61) (41) (42)
Prepaid expenses and other current assets (9) (4) (17)
Accounts payable 20 30 —
Accrued payroll, bonus and other benefits due team members 58 12 60
Other current liabilities 47 54 51
Net change in other long-term liabilities 7 23 (4)
Net cash provided by operating activities 1,129 1,088 1,009
Cash flows from investing activities
Development costs of new locations (516) (447) (339)
Other property and equipment expenditures (335) (263) (198)
Purchases of available-for-sale securities (494) (720) (1,252)
Sales and maturities of available-for-sale securities 928 1,054 1,534
Purchases of intangible assets (3) (20) (1)
Decrease (increase) in restricted cash (19) 2 (8)
Payment for purchase of acquired entities, net of cash acquired (4) (73) (22)
Other investing activities (12) (17) (3)
Net cash used in investing activities (455) (484) (289)
Cash flows from financing activities
Purchases of treasury stock (513) (578) (125)
Common stock dividends paid (184) (170) (508)
Issuance of common stock 66 42 81
Excess tax benefit related to exercise of team member stock options 11 9 37
Other financing activities (2) (1) (2)
Net cash used in financing activities (622) (698) (517)
Effect of exchange rate changes on cash and cash equivalents (5) (6) (2)
Net change in cash and cash equivalents 47 (100) 201
Cash and cash equivalents at beginning of period 190 290 89
Cash and cash equivalents at end of period $ 237 $ 190 $ 290
Supplemental disclosure of cash flow information:
Federal and state income taxes paid $ 383 $ 429 $ 378
The accompanying notes are an integral part of these consolidated financial statements.
38
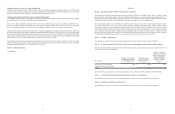
Whole Foods Market, Inc.
Notes to Consolidated Financial Statements
Fiscal years ended September 27, 2015, September 28, 2014 and September 29, 2013
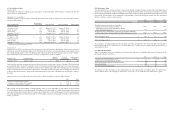
(1) Description of Business
Whole Foods Market is the leading natural and organic foods supermarket and is a mission-driven company that aims to set the
standards of excellence in food retailing. Through our growth, we have had a significant and positive impact on the natural and
organic foods movement throughout the United States, helping lead the industry to nationwide acceptance over the last 37 years.
As of September 27, 2015, we operated 431 stores: 412 stores in 42 United States (“U.S.”) states and the District of Columbia;
10 stores in Canada; and 9 stores in the United Kingdom (“U.K.”). The Company has one operating segment and a single
reportable segment, natural and organic foods supermarkets.
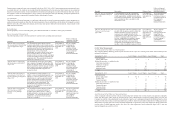
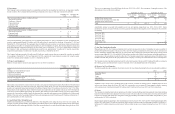
The following is a summary of annual percentage sales and net long-lived assets by geographic area for the fiscal years indicated:
2015 2014 2013
Sales:
United States 96.9% 96.7% 96.7%
Canada and United Kingdom 3.1 3.3 3.3
Total sales 100.0% 100.0% 100.0%
Long-lived assets, net:
United States 97.4% 96.0% 95.7%
Canada and United Kingdom 2.6 4.0 4.3
Total long-lived assets, net 100.0% 100.0% 100.0%
The following is a summary of annual percentage sales by product category for the fiscal years indicated:
2015 2014 2013
Perishables:
Prepared foods and bakery 19.0% 19.2% 19.0%
Other perishables 47.5 47.6 47.2
Total perishables 66.5 66.8 66.2
Non-perishables 33.5 33.2 33.8
Total sales 100.0% 100.0% 100.0%
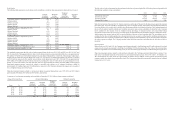
(2) Summary of Significant Accounting Policies
Definition of Fiscal Year
The Company reports its results of operations on a 52- or 53-week fiscal year ending on the last Sunday in September. Fiscal
years 2015, 2014 and 2013 were 52-week years.
Principles of Consolidation
The accompanying consolidated financial statements have been prepared in accordance with U.S. generally accepted accounting
principles. All significant majority-owned subsidiaries are consolidated on a line-by-line basis, and all significant intercompany
accounts and transactions are eliminated upon consolidation.
Cash and Cash Equivalents
We consider all highly liquid investments with an original maturity of 90 days or less to be cash equivalents.
Investments
Available-for-sale investments are recorded at fair value. Unrealized holding gains and losses, net of the related tax effect, on
available-for-sale investments are excluded from earnings and are reported as a separate component of shareholders’ equity until
realized. A decline in the fair value of any available-for-sale security below cost that is deemed to be other than temporary results
in a reduction of the carrying amount to fair value. The impairment is charged to earnings and a new cost basis of the security
is established. The Company considers several factors when determining whether an impairment is other than temporary,
including the extent and duration of the decline in fair value and whether it is more likely than not that we will be required to
sell the security before recovery of its basis. Cost basis is established and maintained utilizing the specific identification method.
The Company also holds certain equity interests accounted for using the cost method of accounting. Equity investments without
readily determinable fair values for which we do not have the ability to exercise significant influence are accounted for using