Whole Foods 2015 Annual Report Download - page 14
Download and view the complete annual report
Please find page 14 of the 2015 Whole Foods annual report below. You can navigate through the pages in the report by either clicking on the pages listed below, or by using the keyword search tool below to find specific information within the annual report.-
 1
1 -
2
-
3
-
 4
4 -
 5
5 -
 6
6 -
 7
7 -
 8
8 -
 9
9 -
 10
10 -
 11
11 -
 12
12 -
 13
13 -
 14
14 -
 15
15 -
 16
16 -
 17
17 -
 18
18 -
 19
19 -
 20
20 -
 21
21 -
 22
22 -
 23
23 -
 24
24 -
25
-
26
-
27
-
28
-
29
-
30
-
31
-
32
-
33
-
34
-
35
-
36
-
37
-
38
 |
 |

15
Item 2. Properties.
As of September 27, 2015, we operated 431 stores: 412 stores in 42 U.S. states and the District of Columbia; 10 stores in Canada;
and 9 stores in the U.K. We own 16 stores and three distribution facilities. We also own three properties leased to third parties;
a building on leased land, which is leased to third parties; and a parking facility on leased land. All other stores, distribution
centers, bakehouses and administrative facilities are leased, and we have options to renew most of our leases in five-year
increments. In addition, as of September 27, 2015, we had 27 leased properties and adjacent spaces that are not being utilized
in current operations, of which 15 are related to our acquisition of Wild Oats Markets in August 2007. We are actively negotiating
to sublease or terminate leases related to these locations.
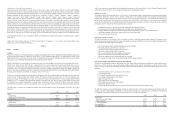
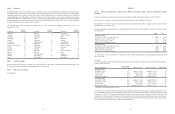
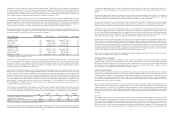
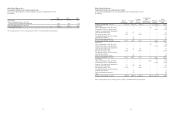
The following table shows the number of our stores by U.S. state, the District of Columbia, Canada and the U.K. as of
September 27, 2015:
Location Number
of stores Location Number
of stores Location Number
of stores
Alabama 2 Kansas 4 New York 16
Arizona 11 Kentucky 2 North Carolina 12
Arkansas 1 Louisiana 5 Ohio 9
California 80 Maine 1 Oklahoma 3
Canada 10 Maryland 9 Oregon 8
Colorado 20 Massachusetts 30 Pennsylvania 10
Connecticut 9 Michigan 6 Rhode Island 3
District of Columbia 4 Minnesota 6 South Carolina 4
Florida 24 Mississippi 1 Tennessee 6
Georgia 10 Missouri 2 Texas 28
Hawaii 3 Nebraska 2 United Kingdom 9
Idaho 1 Nevada 5 Utah 5
Illinois 25 New Hampshire 1 Virginia 11
Indiana 4 New Jersey 14 Washington 8
Iowa 1 New Mexico 4 Wisconsin 2
Item 3. Legal Proceedings.
Information related to our legal proceedings is discussed in Note 15 of the Notes to Consolidated Financial Statements in Part
II, “Item 8. Financial Statements and Supplementary Data,” of this report.
Item 4. Mine Safety Disclosures.
Not applicable.
16
PART II
Item 5. Market for Registrant’s Common Equity, Related Stockholder Matters and Issuer Purchases of Equity
Securities.
Whole Foods Market’s common stock is traded on the NASDAQ Global Select Market under the symbol “WFM.”
The Company is a member of the Standard & Poor’s S&P 500 Index and the NASDAQ-100® Index.
On September 15, 2015, the Company increased the number of authorized shares of the Company’s common stock from 600
million shares to 1.2 billion shares.
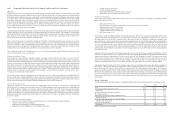
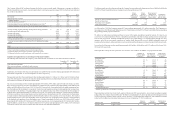
The following table sets forth the intra-day quarterly high and low sale prices of the Company’s common stock for fiscal years
2015 and 2014:
High Low
)LVFDO\HDU
September 29, 2014 to January 18, 2015 $ 52.40 $ 36.24
January 19, 2015 to April 12, 2015 57.57 50.70
April 13, 2015 to July 5, 2015 52.16 39.10
July 6, 2015 to September 27, 2015 41.97 30.18
)LVFDO\HDU
September 30, 2013 to January 19, 2014 $ 65.59 $ 52.04
January 20, 2014 to April 13, 2014 56.42 48.91
April 14, 2014 to July 6, 2014 51.33 37.02
July 7, 2014 to September 28, 2014 40.45 36.08
As of November 11, 2015, there were 1,343 holders of record of Whole Foods Market’s common stock, and the closing stock
price was $29.92.
Dividends
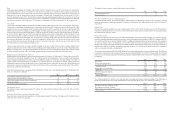
The following table provides a summary of dividends declared per common share during fiscal years 2015 and 2014 (in millions,
except per share amounts):
Date of declaration Dividend per
common share Date of record Date of payment Total amount
)LVFDO\HDU
November 5, 2014 $ 0.13 January 16, 2015 January 27, 2015 $ 47
March 10, 2015 0.13 April 10, 2015 April 21, 2015 47
June 9, 2015 0.13 July 2, 2015 July 14, 2015 47
September 15, 2015 (1) 0.13 October 2, 2015 October 13, 2015 45
)LVFDO\HDU
November 1, 2013 $ 0.12 January 17, 2014 January 28, 2014 $ 45
February 24, 2014 0.12 April 11, 2014 April 22, 2014 44
June 12, 2014 0.12 July 3, 2014 July 15, 2014 44
September 11, 2014 0.12 September 26, 2014 October 7, 2014 43
(1) Dividend accrued at September 27, 2015
On November 4, 2015, the Company’s Board of Directors authorized an increase in the Company’s quarterly dividend to $0.135
per common share from $0.13 per common share, payable on January 26, 2016, to shareholders of record at the close of business
on January 15, 2016. The Company will pay future dividends at the discretion of the Company’s Board of Directors. The
continuation of these payments, the amount of such dividends, and the form in which dividends are paid (cash or stock) depend
on many factors, including the results of operations and the financial condition of the Company. Subject to these qualifications,
the Company currently expects to pay dividends on a quarterly basis.