Whirlpool 2004 Annual Report Download - page 7
Download and view the complete annual report
Please find page 7 of the 2004 Whirlpool annual report below. You can navigate through the pages in the report by either clicking on the pages listed below, or by using the keyword search tool below to find specific information within the annual report.-
 1
1 -
 2
2 -
 3
3 -
 4
4 -
 5
5 -
 6
6 -
 7
7 -
 8
8 -
 9
9 -
 10
10 -
 11
11 -
 12
12 -
 13
13 -
 14
14 -
 15
15 -
 16
16 -
 17
17 -
 18
18 -
19
-
20
-
21
-
22
-
23
-
24
-
25
-
26
-
27
-
28
-
29
-
30
-
31
-
32
-
33
-
34
-
35
-
36
-
37
-
38
-
39
-
40
 |
 |

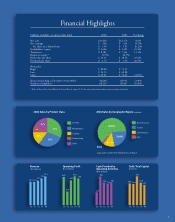
(millions of dollars, except per share data) 2004 2003 % Change
Net sales $13,220 $12,176 8.6%
Net earnings $ 406 $ 414 (1.9)%
Per share on a diluted basis $ 5.90 $ 5.91 (0.2)%
Stockholders' equity $ 1,606 $ 1,301 23.4%
Total assets $ 8,181 $ 7,361 11.1%
Return on equity * 30.3% 42.9%
Book value per share $ 23.31 $ 18.56 25.6%
Dividends per share $ 1.72 $ 1.36 26.5%
Share price
High $ 80.00 $ 73.35
Low $ 54.53 $ 42.80
Close $ 69.21 $ 72.65 (4.7)%
Shares outstanding at December 31 (in 000's) 66,604 68,931 (3.4)%
Number of employees 68,125 68,407 (0.4)%
* Refer to Eleven-Year Consolidated Statistical Review (pages 32-33) for more information about return on equity calculation.
Financial Highlights
2004 Sales by Product Class 2004 Sales by Geographic Region (in millions)
Other
Dishwashing
Cooking
Refrigeration
Laundry
Asia
Latin America
Europe
North America
31%
29%
$8,254
$3,062
$1,674
$382
15%
8%
17%
04
03
02
01
00
Revenue
($ in billions)
0403020100
Operating Profit
($ in millions)
0403020100 0403020100
Cash Provided by
Operating Activities
($ in millions)
Debt/Total Capital
(percent)
807
306
692
830
758
49.4 48.0
65.1
50.9
45.7
13.2
12.2
11.0
10.3
10.3
993
445
785 744 794
2004 Sales exclude other/eliminations of $(152).
5