Whirlpool 2004 Annual Report Download - page 36
Download and view the complete annual report
Please find page 36 of the 2004 Whirlpool annual report below. You can navigate through the pages in the report by either clicking on the pages listed below, or by using the keyword search tool below to find specific information within the annual report.-
 1
1 -
2
-
3
-
4
-
5
-
6
-
7
-
8
-
9
-
10
-
11
-
12
-
13
-
14
-
15
-
16
-
17
-
18
-
19
-
20
-
21
-
22
-
23
-
24
-
25
-
 26
26 -
 27
27 -
 28
28 -
 29
29 -
 30
30 -
 31
31 -
 32
32 -
 33
33 -
 34
34 -
 35
35 -
 36
36 -
 37
37 -
 38
38 -
 39
39 -
 40
40
 |
 |

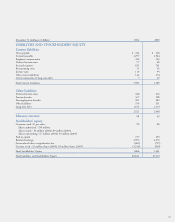
32
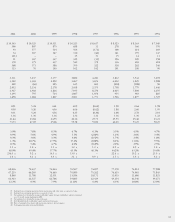
Eleven-Year Consolidated Statistical Review
(Millions of dollars except share and employee data) 2004 2003 2002
Consolidated operations
Net sales $ 13,220 $ 12,176 $ 11,016
Operating profit (1) 758 830 692
Earnings (loss) from continuing operations before income taxes and other items 616 652 495
Earnings (loss) from continuing operations 406 414 262
Earnings (loss) from discontinued operations (2) – – (43)
Net earnings (loss) (3) 406 414 (394)
Net capital expenditures 511 423 430
Depreciation 443 423 391
Dividends 116 94 91
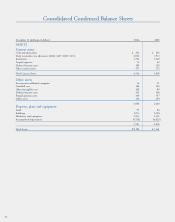
Consolidated financial position
Current assets 4,514 3,865 3,327
Current liabilities 3,985 3,589 3,505
Working capital 529 276 (178)
Property, plant and equipment-net 2,583 2,456 2,338
Total assets 8,181 7,361 6,631
Long-term debt 1,160 1,134 1,092
Stockholders' equity 1,606 1,301 739
Per share data
Basic earnings (loss) from continuing operations before accounting change 6.02 6.03 3.86
Diluted earnings (loss) from continuing operations before accounting change 5.90 5.91 3.78
Diluted net earnings (loss) (3) 5.90 5.91 (5.68)
Dividends 1.72 1.36 1.36
Book value 23.31 18.56 10.67
Closing stock price - NYSE 69.21 72.65 52.22
Key ratios(4)
Operating profit margin 5.7% 6.8% 6.3%
Pre-tax margin (5) 4.7% 5.4% 4.5%
Net margin (6) 3.1% 3.4% 2.4%
Return on average stockholders' equity (7) 30.3% 42.9% (26.5)%
Return on average total assets (8) 5.2% 5.9% (5.8)%
Current assets to current liabilities 1.1 x 1.1 x 0.9 x
Total debt-appliance business as a percent of invested capital (9) 45.7% 50.9% 65.1%
Price earnings ratio 11.7 x 12.3 x (9.2)x
Interest coverage (10) 5.8 x 5.7 x (0.4)x
Other data
Number of common shares outstanding (in thousands):
Average - on a diluted basis 68,902 70,082 69,267
Year-end 66,604 68,931 68,226
Number of stockholders (year-end) 7,826 8,178 8,556
Number of employees (year-end) 68,125 68,407 68,272
Total return to shareholders (five-year annualized) (11) 3.7% 8.1% 1.4%
(1) Restructuring and special operating charges were $22 million in 2004, $14 million in 2003, $161 million in 2002, $212 million in 2001, $405 million in 1997, $30 million in 1996, and $250 million in 1994.
(2) The company's financial services business was discontinued in 1997.
(3) Includes cumulative effect of accounting changes: 2002 - Accounting for goodwill under SFAS No.141 and 142 and impairments of $(613) million or $(8.84) per diluted share; 2001 - Accounting for derivative instruments
and hedging activities of $8 million or $0.12 per diluted share; 1993 - Accounting for postretirement benefits other than pensions of $(180) million or $(2.42) per diluted share.
(4) Key ratios include charges for restructuring and related charges, as well as other non-recurring items, which increased (decreased) operating profit, earnings before tax and net earnings in the following years: 2002 -
Accounting for goodwill under SFAS No. 141 and 142 and impairments of $0, $0, and $(613) million, restructuring and related charges $(161) million, $(161) million and $(121) million, discontinued operations and
accounting changes of $(19) million, $(19) million and $(57) million, and a minority investment write-off in a European business of $0, $0 and $(22) million; 2001 - Restructuring and related charges of $(212) million,
$(212) million and $(156) million, product recalls of $(295) million, $(295) million and $(181) million, and discontinued operations and accounting changes of $0, $0 and $(13) million; 1999 - Brazil devaluation of $0,
$(158) million and $(60) million; 1998 - Gain from discontinued operations of $0, $0 and $15 million; 1997 - Restructuring and related charges of $(396) million, $(401) million and $(252) million.