Whirlpool 2004 Annual Report Download - page 37
Download and view the complete annual report
Please find page 37 of the 2004 Whirlpool annual report below. You can navigate through the pages in the report by either clicking on the pages listed below, or by using the keyword search tool below to find specific information within the annual report.-
 1
1 -
2
-
3
-
4
-
5
-
6
-
7
-
8
-
9
-
10
-
11
-
12
-
13
-
14
-
15
-
16
-
17
-
18
-
19
-
20
-
21
-
22
-
23
-
24
-
25
-
26
-
 27
27 -
 28
28 -
 29
29 -
 30
30 -
 31
31 -
 32
32 -
 33
33 -
 34
34 -
 35
35 -
 36
36 -
 37
37 -
 38
38 -
 39
39 -
 40
40
 |
 |

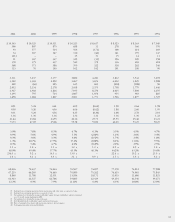
2001 2000 1999 1998 1997 1996 1995 1994
$ 10,343 $ 10,325 $ 10,511 $ 10,323 $ 8,617 $ 8,523 $ 8,163 $ 7,949
306 807 875 688 11 278 366 370
93 577 514 564 (171) 100 214 269
34 367 347 310 (46) 141 195 147
(21) – – 15 31 15 14 11
21 367 347 325 (15) 156 209 158
378 375 437 542 378 336 483 418
368 371 386 399 322 318 282 246
113 70 103 102 102 101 100 90
3,311 3,237 3,177 3,882 4,281 3,812 3,541 3,078
3,102 3,303 2,892 3,267 3,676 4,022 3,829 2,988
209 (66) 285 615 605 (210) (288) 90
2,052 2,134 2,178 2,418 2,375 1,798 1,779 1,440
6,967 6,902 6,826 7,935 8,270 8,015 7,800 6,655
1,295 795 714 1,087 1,074 955 983 885
1,458 1,684 1,867 2,001 1,771 1,926 1,877 1,723
0.51 5.24 4.61 4.09 (0.62) 1.90 2.64 1.98
0.50 5.20 4.56 4.06 (0.62) 1.88 2.60 1.95
0.31 5.20 4.56 4.25 (0.20) 2.08 2.78 2.10
1.36 1.36 1.36 1.36 1.36 1.36 1.36 1.22
21.44 23.84 24.55 26.16 23.71 25.93 25.40 23.21
73.33 47.69 65.06 55.38 55.00 46.63 53.25 50.25
3.0% 7.8% 8.3% 6.7% 0.1% 3.3% 4.5% 4.7%
0.9% 5.6% 4.9% 5.5% (2.0)% 1.2% 2.6% 3.4%
0.3% 3.6% 3.3% 3.0% (0.5)% 1.7% 2.4% 1.8%
1.3% 20.7% 17.9% 17.2% (0.8)% 8.2% 11.6% 9.5%
0.3% 5.4% 4.7% 4.0% (0.2)% 2.0% 2.9% 2.5%
1.1 x 1.0 x 1.1 x 1.2 x 1.2 x 0.9 x 0.9 x 1.0 x
48.0% 49.4% 37.7% 43.5% 46.1% 44.2% 45.2% 35.6%
236.5 x 9.2 x 14.3 x 13.0 x -- 22.4 x 19.2 x 23.9 x
1.4 x 4.1 x 4.3 x 3.1 x 0.9 x 2.5 x 3.4 x 4.2 x
68,036 70,637 76,044 76,507 74,697 77,178 76,812 77,588
67,215 66,265 74,463 76,089 75,262 74,415 74,081 73,845
8,840 11,780 12,531 13,584 10,171 11,033 11,686 11,821
61,923 62,527 62,706 59,885 62,419 49,254 46,546 39,671
12.2% 0.3% 7.9% (1.2)% 6.8% 6.3% 20.8% 12.0%
(5) Earnings from continuing operations before income taxes and other items, as a percent of sales.
(6) Earnings from continuing operations, as a percent of sales.
(7) Net earnings (loss), divided by average stockholders' equity. Average stockholders' equity is computed
on a 13-month average beginning in 2001.
(8) Net earnings (loss), divided by average total assets.
(9) Debt divided by debt, stockholders' equity and minority interests.
(10) Ratio of earnings before interest and income tax expense to interest expense.
(11) Stock appreciation plus reinvested dividends.
33