Westjet 2001 Annual Report Download - page 22
Download and view the complete annual report
Please find page 22 of the 2001 Westjet annual report below. You can navigate through the pages in the report by either clicking on the pages listed below, or by using the keyword search tool below to find specific information within the annual report.-
 1
1 -
2
-
3
-
4
-
5
-
6
-
7
-
8
-
9
-
10
-
11
-
 12
12 -
 13
13 -
 14
14 -
 15
15 -
 16
16 -
 17
17 -
 18
18 -
 19
19 -
 20
20 -
 21
21 -
 22
22 -
 23
23 -
 24
24 -
 25
25 -
 26
26 -
 27
27 -
 28
28 -
 29
29 -
 30
30 -
 31
31 -
 32
32 -
33
-
34
-
35
-
36
-
37
-
38
-
39
-
40
-
41
-
42
-
43
-
44
-
45
-
46
-
47
-
48
-
49
-
50
-
51
-
52
-
53
-
54
-
55
-
56
-
57
-
58
-
59
-
60
 |
 |

20
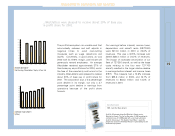
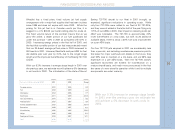
Consistent with prior years, 94.7% of WestJet’s
revenue is derived from scheduled domestic
passenger service. Once the revenues derived from
sundry fees such as extra baggage, kennels,
changes, cancellations and items directly related to
that core business, the number is more like 97%.
Approximately 2% of revenues relates to charter
services, which are either ad hoc such as
professional sports teams, or more scheduled and
contracted services for vacation and tour companies
to U.S. destinations such as Las Vegas. Cargo
accounted for $1.6 million, or less than one-third of
a percent of our total revenue. The remainder of our
revenue relates to promotional travel packages, as
well as income from third party usage of our
simulators and hangar space.
Revenue passenger miles (RPMs) – the number of
revenue passengers multiplied by the total distance
flown – increased 53.9% over 2000 compared with
a 57.1% increase in ASMs. This equated to a slight
decline in load factor in 2001 to 74.7% as compared
with 76.2% in the previous year; however, load
factor is a measure that can be managed, and is not
a good stand-alone measure of performance. By
discounting fare prices, airlines will increase load
factor, or conversely, by pricing fares with a
premium, airlines will decrease their load factor.
For WestJet, an annual average load factor above
75%, as was the case in 2000, is too high. At this
level, during peak times of the day, week, month, or
year, our planes are full and we have no seats to
offer to the higher yield last-minute traveller. It also
means that at those busy times, we are
encountering slower turn times between flights and
straining our system and people. In short, there is
more demand for our product than the capacity that
we have available. We purposely set out to manage
our load factor down to below 75% in 2001 through
pricing strategies.
WestJet’s yield, or revenue per RPM, at 22.9 cents
in 2000, reduced 6.6% to 21.4 cents in 2001. There
exists an important relationship between any
airline’s average stage length (average flight
distance), and unit measures of revenue and costs.
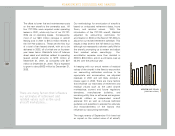
Revenues
Total revenues increased 43.9% over 2000’s $333 million to
$478 million in 2001.
In short, there is more demand for our product than
the capacity that we have available.
MANAGEMENT’S DISCUSSION AND ANALYSIS