Unilever 2000 Annual Report Download - page 9
Download and view the complete annual report
Please find page 9 of the 2000 Unilever annual report below. You can navigate through the pages in the report by either clicking on the pages listed below, or by using the keyword search tool below to find specific information within the annual report.-
 1
1 -
 2
2 -
 3
3 -
 4
4 -
 5
5 -
 6
6 -
 7
7 -
 8
8 -
 9
9 -
 10
10 -
 11
11 -
 12
12 -
 13
13 -
 14
14 -
 15
15 -
 16
16 -
 17
17 -
 18
18 -
 19
19 -
 20
20 -
21
-
22
-
23
-
24
-
25
-
26
-
27
-
28
-
29
-
30
-
31
-
32
-
33
-
34
-
35
-
36
-
37
-
38
-
39
-
40
-
41
-
42
-
43
-
44
-
45
-
46
-
47
-
48
-
49
-
50
-
51
-
52
-
53
-
54
-
55
-
56
-
57
-
58
-
59
-
60
-
61
-
62
-
63
-
64
-
65
-
66
-
67
-
68
-
69
-
70
-
71
-
72
-
73
-
74
-
75
-
76
-
77
-
78
-
79
-
80
-
81
-
82
-
83
-
84
-
85
-
86
-
87
-
88
-
89
-
90
-
91
-
92
-
93
-
94
-
95
-
96
-
97
-
98
-
99
-
100
-
101
-
102
-
103
-
104
-
105
-
106
-
107
-
108
-
109
-
110
-
111
-
112
-
113
-
114
-
115
-
116
-
117
-
118
-
119
-
120
-
121
-
122
-
123
-
124
-
125
-
126
-
127
-
128
 |
 |

7
Unilever Annual Report & Accounts and Form 20-F 2000 Report of the Directors
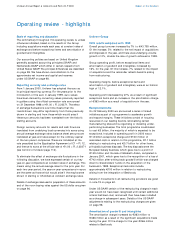
Operating review - highlights
Basis of reporting and discussion
The commentary throughout this operating review is, unless
otherwise indicated, based on the results of the Group
including acquisitions made each year, at constant rates of
exchange and before exceptional items and amortisation of
goodwill and intangibles.
Our accounting policies are based on United Kingdom
generally accepted accounting principles (GAAP) and
Netherlands GAAP which differ in certain respects from
United States GAAP. The principal differences are described
on page 99. We have shown reconciliations to the
approximate net income and capital and reserves
under US GAAP on page 98.
Reporting currency and exchange rates
From 1 January 2000, Unilever has adopted the euro as
its principal reporting currency. For the years prior to the
introduction of the euro in January 1999, euro values
have been derived by converting values previously reported
in guilders using the official conversion rate announced
on 31 December 1998 of 1.00 = Fl. 2.20371. The effect
of exchange fluctuations over time means that the
trends show n may differ significantly from those previously
shown in sterling and from those w hich would arise if
these euro amounts had been translated from the historic
sterling accounts.
Foreign currency amounts for results and cash flows are
translated from underlying local currencies into euros using
annual average exchange rates; balance sheet amounts are
translated at year-end rates except for the ordinary capital
of the two parent companies. These are translated at the
rate prescribed by the Equalisation Agreement of £1 = Fl. 12,
and thence to euros at the official rate of 1.00 = Fl. 2.20371
(see Control of Unilever page 112).
To eliminate the effect of exchange rate fluctuations in the
following discussion, we have expressed certain of our key
year-on-year comparisons at constant rates of exchange. This
means using the annual average rates for the prior year. For
each two-year period, the year-on-year comparisons in euros
are the same as those which would arise if the results were
shown in sterling or US dollars at constant exchange rates.
Details of exchange rates used in preparation of these accounts
and of the noon buying rates against the US dollar are given
on page 96.
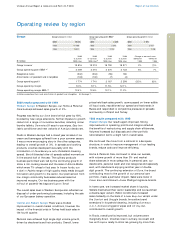
Unilever Group
2000 results compared with 1999
Overall group turnover increased by 7% to 43 793 million.
Of the increase, 5% related to the net impact of acquisitions
and disposals in the year, and there was underlying volume
growth of 2% , double the rate of growth achieved in 1999.
Group operating profit, before exceptional items and
amortisation of goodwill and intangibles, increased by
16% for the year. Of this increase, 7% related to the impact
of acquisitions and the remainder reflects benefits arising
from restructuring.
Operating margins, before exceptional items and
amortisation of goodwill and intangibles, w ere at an historic
high of 12.1% .
Operating profit decreased by 27% as a result of significant
exceptional items and an increase in the amortisation charge
of 363 million as a result of acquisitions in the year.
Exceptional items
On 22 February 2000 w e announced a series of linked
initiatives as part of a programme to accelerate growth
and expand margins. These initiatives consist of focusing
resources on our leading brands, rationalising certain
manufacturing sites and re-organising or divesting under-
performing businesses. The total programme is estimated
to cost 5 billion, the majority of w hich is expected to be
exceptional. Included in operating profit in 2000 was a
1.8 billion exceptional charge and 100 million of
associated costs in relation to this programme, 1.1 billion
relating to restructuring and 0.7 billion for other items,
principally business disposals. The key disposals w ere the
European bakery business, which gave rise to a profit of
149 million and the sale of Elizabeth Arden, completed in
January 2001, w hich gave rise to the recognition of a loss of
742 million after writing back goodw ill which was charged
direct to shareholders’ funds on the acquisition of the
business in 1989. Exceptional items also include
approximately 100 million in relation to restructuring
arising from the integration of Bestfoods.
Details of movements in all restructuring provisions are given
in note 19 on page 62.
Under US GAAP, certain of the restructuring charges in each
year w ould not have been recognised until certain additional
criteria had been met, and would then have been included
as a charge in subsequent years. Details of the US GAAP
adjustments relating to the restructuring charges are given
on page 98.
Amortisation of goodwill and intangibles
The amortisation charge increased by 363 million to
386 million as a result of the significant acquisitions made
during the year. Of the charge for the year 266 million
relates to Bestfoods.