Unilever 2000 Annual Report Download - page 14
Download and view the complete annual report
Please find page 14 of the 2000 Unilever annual report below. You can navigate through the pages in the report by either clicking on the pages listed below, or by using the keyword search tool below to find specific information within the annual report.-
 1
1 -
2
-
3
-
 4
4 -
 5
5 -
 6
6 -
 7
7 -
 8
8 -
 9
9 -
 10
10 -
 11
11 -
 12
12 -
 13
13 -
 14
14 -
 15
15 -
 16
16 -
 17
17 -
 18
18 -
 19
19 -
 20
20 -
 21
21 -
 22
22 -
 23
23 -
 24
24 -
25
-
26
-
27
-
28
-
29
-
30
-
31
-
32
-
33
-
34
-
35
-
36
-
37
-
38
-
39
-
40
-
41
-
42
-
43
-
44
-
45
-
46
-
47
-
48
-
49
-
50
-
51
-
52
-
53
-
54
-
55
-
56
-
57
-
58
-
59
-
60
-
61
-
62
-
63
-
64
-
65
-
66
-
67
-
68
-
69
-
70
-
71
-
72
-
73
-
74
-
75
-
76
-
77
-
78
-
79
-
80
-
81
-
82
-
83
-
84
-
85
-
86
-
87
-
88
-
89
-
90
-
91
-
92
-
93
-
94
-
95
-
96
-
97
-
98
-
99
-
100
-
101
-
102
-
103
-
104
-
105
-
106
-
107
-
108
-
109
-
110
-
111
-
112
-
113
-
114
-
115
-
116
-
117
-
118
-
119
-
120
-
121
-
122
-
123
-
124
-
125
-
126
-
127
-
128
 |
 |

2000 results compared with 1999
In Africa and M iddle East, overall sales were up by 3% , with
profits increasing by 9% .
The momentum in Africa was driven by progress across all
our key categories, with particularly strong performances
from laundry, oral care, deodorants and culinary products. We
increased the direct coverage of outlets with the roll-out of
a distribution model based on our experience in rural India.
In South Africa, we introduced laundry tablets, with other
innovative launches including Omo liquid bleach, Flora
pro•activ and Lipton Ice Tea.
Unilever consumer product businesses are being supplied w ith
innovative tea products from our East African plantations.
In the Middle East, sales stagnated in adverse business
conditions and w e concentrated on maintaining market
positions.
1999 results compared with 1998
Our businesses in Africa and M iddle East had another good
year despite depressed oil prices in early 1999 and economic
and political instability in parts of Africa.
Volumes grew by more than 6% in our corporate categories,
operating profits climbed by 17% , sales increased by 8%
and margins also rose.
In Africa, we attained excellent growth in Home & Personal
Care – our largest business in the region. Laundry, oral and
mass skin w ere strong. To increase the affordability of our
brands, we launched sachet versions of toothpaste and
laundry products in most African markets.
Our South African operations flourished, w ith share
increases in priority categories. We introduced our ice
cream brands to the South African townships for the
first time, with smaller, more affordable products. Our
businesses in Côte d’Ivoire and Ghana did well and we
achieved volume growth in Nigeria.
Throughout Africa, w e focused on strengthening our
distribution netw ork by developing exclusive regional
agents, and on increasing the availability of our products
with a more effective sales approach.
In the Middle East, our Egyptian Foods and Home &
Personal Care companies w ere successfully merged. We
developed our out-of-home tea portfolio by introducing
Lipton branding into thousands of independent tea shops –
creating new Unilever channels to consumers. Indicative
of our ability to satisfy local tastes was the roll-out of
Tasbeeka, a ready-made version of a popular tomato-based
culinary product.
Arabia performed strongly, particularly in tea, where we
increased market share by more than 3% . As part of our
strategy of making our supply chain more efficient,
we opened a new tea packing factory in Dubai.
We made good progress in M orocco, where strong growth
in laundry reinforced our position. We made strides in
Israel and built on our successful presence in Lebanon
by launching operations in Jordan and Syria.
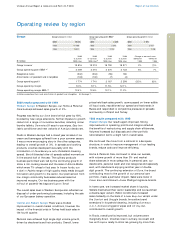
2000 2000 1999 1998 Change at constant rates
at current at constant at current at current 2000 over 1999 over
million 2000 rates 1999 rates(b) 1999 rates 1998 rates 1999 1998
Group turnover 2 447 2 369 2 298 2 228 3% 8%
Group operating profit BEIA (a) 281 273 251 225 9% 17%
Exceptional items (36) (33) 15 (1)
Amortisation of goodwill and intangibles (1) (1) —(1)
Group operating profit 244 239 266 223 (10)% 24%
Group operating margin 10.0% 10.1% 11.6% 10.0%
Group operating margin BEIA (a) 11.5% 11.5% 10.9% 10.1%
(a) Before exceptional items and amortisation of goodw ill and intangibles. (b) See page 7.
Group turnover million Group operating profit BEIA(a)
million
Group operating profit million
2000
1999
1998
2 447
2 298
2 228
2000
1999
1998
244
266
223
2000
1999
1998
281
251
225
Africa and Middle East
Unilever Annual Report & Accounts and Form 20-F 2000
12
Report of the Directors
Operating review by region