Unilever 2000 Annual Report Download - page 5
Download and view the complete annual report
Please find page 5 of the 2000 Unilever annual report below. You can navigate through the pages in the report by either clicking on the pages listed below, or by using the keyword search tool below to find specific information within the annual report.-
 1
1 -
 2
2 -
 3
3 -
 4
4 -
 5
5 -
 6
6 -
 7
7 -
 8
8 -
 9
9 -
 10
10 -
 11
11 -
 12
12 -
 13
13 -
 14
14 -
 15
15 -
 16
16 -
17
-
18
-
19
-
20
-
21
-
22
-
23
-
24
-
25
-
26
-
27
-
28
-
29
-
30
-
31
-
32
-
33
-
34
-
35
-
36
-
37
-
38
-
39
-
40
-
41
-
42
-
43
-
44
-
45
-
46
-
47
-
48
-
49
-
50
-
51
-
52
-
53
-
54
-
55
-
56
-
57
-
58
-
59
-
60
-
61
-
62
-
63
-
64
-
65
-
66
-
67
-
68
-
69
-
70
-
71
-
72
-
73
-
74
-
75
-
76
-
77
-
78
-
79
-
80
-
81
-
82
-
83
-
84
-
85
-
86
-
87
-
88
-
89
-
90
-
91
-
92
-
93
-
94
-
95
-
96
-
97
-
98
-
99
-
100
-
101
-
102
-
103
-
104
-
105
-
106
-
107
-
108
-
109
-
110
-
111
-
112
-
113
-
114
-
115
-
116
-
117
-
118
-
119
-
120
-
121
-
122
-
123
-
124
-
125
-
126
-
127
-
128
 |
 |

3
Unilever Annual Report & Accounts and Form 20-F 2000 Report of the Directors
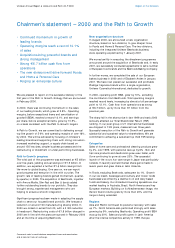
Chairmen’s statement – 2000 and the Path to Growth
We are pleased to report on the successful delivery of the
first year of the Path to Growth strategy that w e announced
in February 2000.
In 2000, there was continuing momentum in the sales
of our leading brands, w hich grew at 3.8% . Operating
margins, before exceptional items and amortisation of
goodwill (BEIA), reached a record 12.1% and earnings
per share, before exceptional items, grew by 10.5% ,
on a basis consistent w ith the Path to Growth targets.
In Path to Growth, we are committed to delivering annual
top line growth of 5-6% and operating margins of over 16% ,
by 2004. This will be achieved by focusing on Unilever’s
leading brands and supporting them w ith strong innovation,
increased marketing support, a supply chain based on
around 150 key sites, simpler business processes and the
restructuring or divestment of under-performing businesses.
Path to Growth progress
The total cost of the programme was estimated at 5 billion
over five years, yielding annual savings of 1.5 billion. In
addition, w e expected a further 1.6 billion savings from
the move to global buying. One year on, we can report
good progress and execution in line with our plan. The
growth rate of leading brands gained momentum, quarter-
by-quarter, in 2000. The acquisition of Bestfoods, together
with Amora M aille, Slim•Fast and Ben & Jerry’s added
further outstanding brands to our portfolio. They also
brought strong, experienced management who are
helping to ensure a smooth integration.
Significant progress has been made in adapting the supply
chain to serve our focused brand portfolio. We forecast a
reduction of around 100 manufacturing sites by 2004. In
2000 we closed or exited from 23, with a 5 300 reduction
in headcount. Restructuring costs of 1.8 billion charged in
2000 are in line with the plans announced in February 2000
and at the time of acquiring Bestfoods.
New organisation structure
In August 2000, w e announced a new organisation
structure, based on tw o divisions, to give sharper focus
to Foods and Home & Personal Care. The two divisions,
including the integrated Unilever Bestfoods business,
were operating as planned by 1 January 2001.
We moved sw iftly in executing the divestment programme
announced around the acquisition of Bestfoods and, in early
2001, we successfully concluded agreements to sell a number
of European food brands and the Bestfoods Baking Company.
In further moves, we completed the sale of our European
bakery business in 2000 and of Elizabeth Arden in January
2001. We have now placed our successful and profitable
Prestige fragrance brands w ithin a single organisation,
Unilever Cosmetics International, dedicated to growth.
In 2000, operating profit BEIA, grew by 10% , excluding
the contribution from Bestfoods. Total operating margins
reached record levels, increasing by almost a full percentage
point to 12.1% . Cash flow from operations was strong
at 6.7 billion, up by more than 1 billion from the
previous year.
The sharp fall in the share price in late 1999 and early 2000
seriously affected our Total Shareholder Return (TSR)
ranking. In our peer group of 21 international businesses
we dropped to 13th place, measured over three years.
Successful execution of the Path to Growth w ill generate
substantial and sustained value for shareholders. We are
committed to achieving a sustained top third TSR ranking.
Categories
Sales of home care and professional cleaning products grew
by 4% over 1999, with personal care up by 6% . Skin and
hair care products and deodorants grew even faster, with
Dove continuing to grow at over 20% . The successful
launch of the mod’s hair care range in Japan was particularly
notable. In laundry w e held market share gains made in
recent years and grew share in Latin America.
In Foods, excluding Bestfoods, sales grew by 1% . Growth
in our ice cream, beverages and culinary and frozen foods
businesses w as offset by a decline in oil and dairy based
foods and bakery. Our cholesterol-low ering spreads are now
market leading in Australia, Brazil, North America and key
European markets. Building on its M editerranean image, the
Bertolli brand volume grew by more than 20% and the
range is being extended.
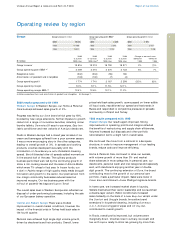
Regions
Asia and Pacific continued its powerful recovery, with sales
up 7% . North America also performed strongly, with sales
growing by 9% , excluding Bestfoods. Operating profit BEIA
was up by 20% . Sales and profits grew in Latin America
after the intense competitive activity in 1999. Europe
• Continued momentum in growth of
leading brands
• Operating margins reach a record 12.1%
of sales
• Acquisitions bring powerful brands and
strong management
• Strong 6.7 billion cash flow from
operations
• The new divisions will drive forward Foods
and Home & Personal Care
• Forging an enterprise culture
Comments refer to results before exceptional items and amortisation
and at constant rates of exchange.