Unilever 2000 Annual Report Download - page 15
Download and view the complete annual report
Please find page 15 of the 2000 Unilever annual report below. You can navigate through the pages in the report by either clicking on the pages listed below, or by using the keyword search tool below to find specific information within the annual report.-
 1
1 -
2
-
3
-
4
-
 5
5 -
 6
6 -
 7
7 -
 8
8 -
 9
9 -
 10
10 -
 11
11 -
 12
12 -
 13
13 -
 14
14 -
 15
15 -
 16
16 -
 17
17 -
 18
18 -
 19
19 -
 20
20 -
 21
21 -
 22
22 -
 23
23 -
 24
24 -
 25
25 -
26
-
27
-
28
-
29
-
30
-
31
-
32
-
33
-
34
-
35
-
36
-
37
-
38
-
39
-
40
-
41
-
42
-
43
-
44
-
45
-
46
-
47
-
48
-
49
-
50
-
51
-
52
-
53
-
54
-
55
-
56
-
57
-
58
-
59
-
60
-
61
-
62
-
63
-
64
-
65
-
66
-
67
-
68
-
69
-
70
-
71
-
72
-
73
-
74
-
75
-
76
-
77
-
78
-
79
-
80
-
81
-
82
-
83
-
84
-
85
-
86
-
87
-
88
-
89
-
90
-
91
-
92
-
93
-
94
-
95
-
96
-
97
-
98
-
99
-
100
-
101
-
102
-
103
-
104
-
105
-
106
-
107
-
108
-
109
-
110
-
111
-
112
-
113
-
114
-
115
-
116
-
117
-
118
-
119
-
120
-
121
-
122
-
123
-
124
-
125
-
126
-
127
-
128
 |
 |

13
Unilever Annual Report & Accounts and Form 20-F 2000 Report of the Directors
Operating review by region
Asia and Pacific
2000 2000 1999 1998 Change at constant rates
at current at constant at current at current 2000 over 1999 over
million 2000 rates 1999 rates(b) 1999 rates 1998 rates 1999 1998
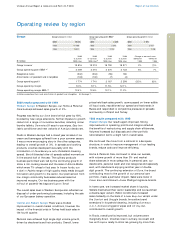
Group turnover 8 038 7 228 6 723 5 803 7% 10%
Group operating profit BEIA (a) 901 822 669 510 23% 24%
Exceptional items (109) (94) (18) (52)
Amortisation of goodwill and intangibles (16) (14) (9) (1)
Group operating profit 776 714 642 457 11% 33%
Group operating margin 9.7% 9.9% 9.6% 7.9%
Group operating margin BEIA (a) 11.2% 11.4% 9.9% 8.8%
(a) Before exceptional items and amortisation of goodw ill and intangibles. (b) See page 7.
Group turnover million Group operating profit BEIA(a)
million
Group operating profit million
2000
1999
1998
8 038
6 723
5 803
2000
1999
1998
776
642
457
2000
1999
1998
901
669
510
2000 results compared with 1999
Sales in the year were 7% ahead of 1999, driven by
excellent performances in South East Asia and Japan.
Profitability rose significantly across the region, while at the
same time we maintained a high level of marketing support.
Our businesses in South East Asia and Japan generated
double digit sales growth in each quarter. Progress w as
broad-based, in both category and geography.
In skin care and hair care, innovation and strong marketing
support levels helped us to good results. Brand successes
included the performance of Dove, Pond’s, mod’s hair and
Lux in Japan and Vaseline shampoo in the Philippines. In
Australasia, we achieved sales grow th in ice cream and
gained market share in laundry.
In China, a repositioned Omo and new variants of Zhonghua
toothpaste helped both brands achieve volume growth
above 20% . In Taiw an, Dove shampoo vied for the number
one market position.
We made further progress in sales of consumer brands in
India as our renewed focus on building mass market share
began to have an impact. At the premium end of the
laundry market, Surf continued to perform w ell. Overall
sales revenues w ere affected by our exit from the imported
fertiliser business and by the impact of low er edible oil prices.
1999 results compared with 1998
Our Asia and Pacific business had a very good year across
most countries in the region, benefiting from the recovery
in South East Asia.
Led by a strong show ing in Home & Personal Care, we achieved
excellent growth in volume and profits. Foods, how ever,
performed less well and profits were marginally below 1998.
Overall margins improved by a full percentage point and
there was significantly increased investment in marketing.
In India, w e had another outstanding year in both volume
and profit growth. Key to this growth w as a powerful
Home & Personal Care performance, w ith particularly good
results in hair, laundry, mass skin and personal wash.
We continued to meet consumer needs w ith innovation,
for example, rolling out a resealable toothpaste sachet
and a miniature Rexona deodorant stick for low er
income consumers.
Foods was less buoyant in India. The business w as
particularly affected by disappointing tea sales which only
started to recover tow ards the end of the year following
the withdrawal of the excise duty on packaged tea
imposed in 1998. How ever, there was an enthusiastic
reception from Indian consumers to the roll-out of our
tea-based beverage Lipton Tiger.
Our operations in China achieved double digit volume
growth, largely due to the accelerating growth of the
Hazeline range of hair products and the successful relaunch
of the brand’s personal w ash range. However, the business
remained in loss, reflecting our continued investment. We
streamlined the business, moving from joint venture based
operations to a three company structure focused on the
core areas of home and personal care, foods and beverages,
and ice cream.
Other activities included the launch of herbal based
Zhonghua toothpaste, entry into the large green tea market
through the purchase of Jinghua, a leading Beijing based
brand, and the acquisition of Mountain Cream ice cream.
In the face of last year’s economic crisis in South East Asia,
the strategy of adapting our portfolio and reaching out
to lower income consumers was successful, leaving us w ell
placed to benefit from the economic recovery. In Indonesia,
turnover grew by a third, and in the Philippines and
Vietnam, where sales were also buoyant, w e achieved
double digit volume growth.