Unilever 2000 Annual Report Download - page 12
Download and view the complete annual report
Please find page 12 of the 2000 Unilever annual report below. You can navigate through the pages in the report by either clicking on the pages listed below, or by using the keyword search tool below to find specific information within the annual report.-
 1
1 -
 2
2 -
 3
3 -
 4
4 -
 5
5 -
 6
6 -
 7
7 -
 8
8 -
 9
9 -
 10
10 -
 11
11 -
 12
12 -
 13
13 -
 14
14 -
 15
15 -
 16
16 -
 17
17 -
 18
18 -
 19
19 -
 20
20 -
 21
21 -
 22
22 -
23
-
24
-
25
-
26
-
27
-
28
-
29
-
30
-
31
-
32
-
33
-
34
-
35
-
36
-
37
-
38
-
39
-
40
-
41
-
42
-
43
-
44
-
45
-
46
-
47
-
48
-
49
-
50
-
51
-
52
-
53
-
54
-
55
-
56
-
57
-
58
-
59
-
60
-
61
-
62
-
63
-
64
-
65
-
66
-
67
-
68
-
69
-
70
-
71
-
72
-
73
-
74
-
75
-
76
-
77
-
78
-
79
-
80
-
81
-
82
-
83
-
84
-
85
-
86
-
87
-
88
-
89
-
90
-
91
-
92
-
93
-
94
-
95
-
96
-
97
-
98
-
99
-
100
-
101
-
102
-
103
-
104
-
105
-
106
-
107
-
108
-
109
-
110
-
111
-
112
-
113
-
114
-
115
-
116
-
117
-
118
-
119
-
120
-
121
-
122
-
123
-
124
-
125
-
126
-
127
-
128
 |
 |

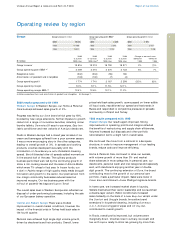
2000 2000 1999 1998 Change at constant rates
at current at constant at current at current 2000 over 1999 over
million 2000 rates 1999 rates(b) 1999 rates 1998 rates 1999 1998
Group turnover 11 631 10 027 8 838 8 417 13% 1%
Group operating profit BEIA (a) 1 476 1 269 974 904 30% 3%
Exceptional items (1 132) (977) (126) 39
Amortisation of goodwill and intangibles (179) (149) (1) (1)
Group operating profit 165 143 847 942 (83)% (14)%
Group operating margin 1.4% 1.4% 9.6% 11.2%
Group operating margin BEIA (a) 12.7% 12.7% 11.0% 10.7%
(a) Before exceptional items and amortisation of goodw ill and intangibles. (b) See page 7.
Group turnover million Group operating profit BEIA(a)
million
Group operating profit million
2000
1999
1998
11 631
8 838
8 417
2000
1999
1998
165
847
942
2000
1999
1998
1 476
974
904
North America
Unilever Annual Report & Accounts and Form 20-F 2000
10
Report of the Directors
Operating review by region
13% . We maintained our market share in yellow fats in
a contracting market. Frozen foods volumes declined,
reflecting the continued focusing of our portfolio. In
December 1999 w e announced the acquisition of the major
French culinary company Amora M aille, which has improved
our culinary market position and geographical coverage.
Central and Eastern Europe It was a challenging year
in the region and our sales and profits w ere dow n.
The economic recovery in Russia was much slow er than
predicted, with a knock-on effect throughout Central
Europe. The Turkish economy w as badly hit by the
natural disasters of 1999 but our company continued
to perform well.
In response to these events w e streamlined our operations
to benefit from the eventual improvement in trading
conditions. In Russia w e significantly reduced the cost base
of our operations and adapted our portfolio. We improved
our competitive position in the market by producing packs
locally and manufacturing Rama and Calvé onshore.
Falls in tea and ice cream profits in the region w ere partly
offset by an improved performance in laundry, particularly
in Turkey.
In Europe as a whole, exceptional items in 1999 mainly
related to the restructuring of our Foods business. In the
previous year, they included the profit on the disposal of
Plant Breeding International.
Europe continued
2000 results compared with 1999
Sales rose by 13% , w ith a strong contribution from
Bestfoods, Slim•Fast and Ben & Jerry’s. Operating margins
showed a significant increase, as the benefits of
restructuring, portfolio improvement and procurement
savings came through.
Although Bestfoods’ sales in the fourth quarter were around
100 million short of our expectations, this w as largely as a
result of action taken to reduce trade inventories in the
United States in both the retail and foodservice channels.
In Foods, our ice cream, tea and culinary products businesses
achieved good sales grow th. In ice cream, the most
significant contributions came from the Breyers Parlor take
home range and from new Popsicle and Klondike novelties.
In culinary products, Lipton meal makers, driven by Sizzle &
Stir, led the advance, while Lipton Cold Brew was a key
player in tea’s success. In the US, we successfully launched
a creamy fruit variant of Brummel & Brown spreads.
In Home & Personal Care, volumes grew by 4% as a result
of an active and strongly supported innovation programme.
Dove, Caress and Suave led growth in personal care and
in hair care we have relaunched Salon Selectives.
Our fabric care business maintained its overall market
position, despite price competition, and the launch of
laundry tablets began well.
In our Prestige fragrance business w e sold much of the
Elizabeth Arden business and launched Nautica and
Calvin Klein Truth.
1999 results compared with 1998
We had a mixed year in North America: Home & Personal
Care achieved excellent results, but our Foods business
returned a weaker performance. Overall, profits rose by
3% with sales and volumes climbing modestly.
Our Home & Personal Care business achieved a 5% volume
growth, well above 1998, with profits also ahead. Our key
brands flourished, with market share increases in our three
priority categories of deodorants, hair and personal wash.
Led by the successful relaunch of Suave and the strong
growth of ThermaSilk, w e achieved daily hair care