Under Armour 2010 Annual Report Download - page 77
Download and view the complete annual report
Please find page 77 of the 2010 Under Armour annual report below. You can navigate through the pages in the report by either clicking on the pages listed below, or by using the keyword search tool below to find specific information within the annual report.-
 1
1 -
2
-
3
-
4
-
5
-
6
-
7
-
8
-
9
-
10
-
11
-
12
-
13
-
14
-
15
-
16
-
17
-
18
-
19
-
20
-
21
-
22
-
23
-
24
-
25
-
26
-
27
-
28
-
29
-
30
-
31
-
32
-
33
-
34
-
35
-
36
-
37
-
38
-
39
-
40
-
41
-
42
-
43
-
44
-
45
-
46
-
47
-
48
-
49
-
50
-
51
-
52
-
53
-
54
-
55
-
56
-
57
-
58
-
59
-
60
-
61
-
62
-
63
-
64
-
65
-
66
-
 67
67 -
 68
68 -
 69
69 -
 70
70 -
 71
71 -
 72
72 -
 73
73 -
 74
74 -
 75
75 -
 76
76 -
 77
77 -
 78
78 -
 79
79 -
 80
80 -
 81
81 -
 82
82 -
 83
83 -
 84
84 -
 85
85 -
 86
86 -
 87
87 -
88
-
89
-
90
-
91
-
92
 |
 |

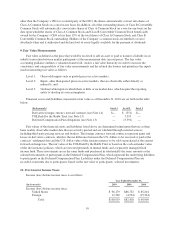
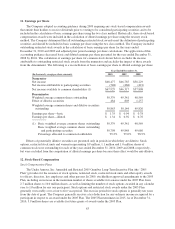
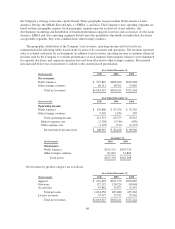
During the years ended December 31, 2010 and 2009, substantially all of the Company’s long-lived assets
were located in the United States. Net revenues in the United States were $952.9 million, $771.2 million and
$660.8 million for the years ended December 31, 2010, 2009 and 2008, respectively.
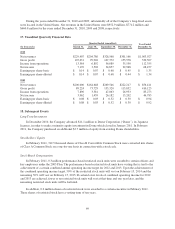
17. Unaudited Quarterly Financial Data
(In thousands)
Quarter Ended (unaudited) Year Ended
December 31,March 31, June 30, September 30, December 31,
2010
Net revenues $229,407 $204,786 $328,568 $301,166 $1,063,927
Gross profit 107,631 99,926 167,372 155,578 530,507
Income from operations 13,584 6,892 56,689 35,190 112,355
Net income 7,170 3,502 34,857 22,948 68,477
Earnings per share-basic $ 0.14 $ 0.07 $ 0.68 $ 0.45 $ 1.35
Earnings per share-diluted $ 0.14 $ 0.07 $ 0.68 $ 0.44 $ 1.34
2009
Net revenues $200,000 $164,648 $269,546 $222,217 $ 856,411
Gross profit 89,224 73,729 133,320 113,852 410,125
Income from operations 7,896 3,381 47,063 26,933 85,273
Net income 3,962 1,439 26,182 15,202 46,785
Earnings per share-basic $ 0.08 $ 0.03 $ 0.52 $ 0.30 $ 0.94
Earnings per share-diluted $ 0.08 $ 0.03 $ 0.52 $ 0.30 $ 0.92
18. Subsequent Events
Long Term Investment
In December 2010, the Company advanced $11.1 million to Dome Corporation (“Dome”), its Japanese
licensee, in order to make a minority equity investment in Dome which closed in January 2011. In February
2011, the Company purchased an additional $3.7 million of equity from existing Dome shareholders.
Stockholders’ Equity
In February 2011, 312.5 thousand shares of Class B Convertible Common Stock were converted into shares
of Class A Common Stock on a one-for-one basis in connection with a stock sale.
Stock-Based Compensation
In February 2011, 0.3 million performance-based restricted stock units were awarded to certain officers and
key employees under the 2005 Plan. The performance-based restricted stock units have vesting that is tied to the
achievement of a certain combined annual operating income target for 2012 and 2013. Upon the achievement of
the combined operating income target, 50% of the restricted stock units will vest on February 15, 2014 and the
remaining 50% will vest on February 15, 2015. If certain lower levels of combined operating income for 2012
and 2013 are achieved, fewer or no restricted stock units will vest at that time and one year later, and the
remaining restricted stock units will be forfeited.
In addition, 0.2 million shares of restricted stock were awarded to a certain executive in February 2011.
These shares of restricted stock have a vesting term of ten years.
69