Under Armour 2010 Annual Report Download - page 40
Download and view the complete annual report
Please find page 40 of the 2010 Under Armour annual report below. You can navigate through the pages in the report by either clicking on the pages listed below, or by using the keyword search tool below to find specific information within the annual report.-
 1
1 -
2
-
3
-
4
-
5
-
6
-
7
-
8
-
9
-
10
-
11
-
12
-
13
-
14
-
15
-
16
-
17
-
18
-
19
-
20
-
21
-
22
-
23
-
24
-
25
-
26
-
27
-
28
-
29
-
 30
30 -
 31
31 -
 32
32 -
 33
33 -
 34
34 -
 35
35 -
 36
36 -
 37
37 -
 38
38 -
 39
39 -
 40
40 -
 41
41 -
 42
42 -
 43
43 -
 44
44 -
 45
45 -
 46
46 -
 47
47 -
 48
48 -
 49
49 -
 50
50 -
51
-
52
-
53
-
54
-
55
-
56
-
57
-
58
-
59
-
60
-
61
-
62
-
63
-
64
-
65
-
66
-
67
-
68
-
69
-
70
-
71
-
72
-
73
-
74
-
75
-
76
-
77
-
78
-
79
-
80
-
81
-
82
-
83
-
84
-
85
-
86
-
87
-
88
-
89
-
90
-
91
-
92
 |
 |

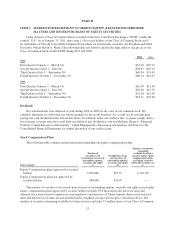
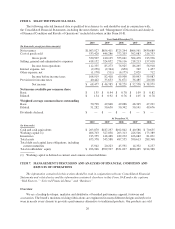
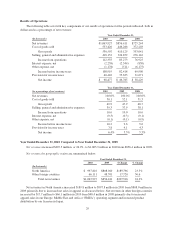
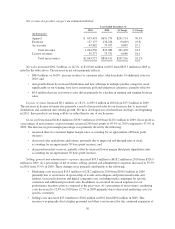
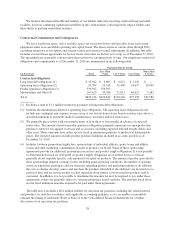
Net revenues by product category are summarized below:
Year Ended December 31,
2009 2008 $ Change % Change
(In thousands)
Apparel $651,779 $578,887 $ 72,892 12.6%
Footwear 136,224 84,848 51,376 60.6
Accessories 35,077 31,547 3,530 11.2
Total net sales 823,080 695,282 127,798 18.4
License revenues 33,331 29,962 3,369 11.2
Total net revenues $856,411 $725,244 $131,167 18.1%
Net sales increased $127.8 million, or 18.4%, to $823.1 million in 2009 from $695.3 million in 2008 as
noted in the table above. The increase in net sales primarily reflects:
• $51.4 million increase in footwear sales driven primarily by our running footwear launch during the
first quarter of 2009;
• $51.8 million increase in direct to consumer sales growth, including the impact of footwear; and
• apparel unit growth driven by increased distribution and new offerings in multiple product categories,
most significantly in our training, fitness, running and underwear categories.
License revenues increased $3.3 million, or 11.2%, to $33.3 million in 2009 from $30.0 million in 2008.
This increase in license revenues was a result of increased sales by our licensees due to increased distribution and
continued unit volume growth, along with new license agreements for team uniforms and custom-molded mouth
guards.
Gross profit increased $57.1 million to $410.1 million in 2009 from $353.0 million in 2008. Gross profit as
a percentage of net revenues, or gross margin, decreased 80 basis points to 47.9% in 2009 compared to 48.7% in
2008. The decrease in gross margin percentage was primarily driven by the following:
• increased footwear and apparel liquidations to third parties, accounting for an approximate 40 basis
point decrease;
• less favorable footwear and apparel product mix relative to margins, accounting for an approximate 40
basis point decrease; and
• increased footwear and accessory inventory reserves, accounting for an approximate 20 basis point
decrease; partially offset by
• increased direct to consumer higher margin sales, accounting for an approximate 30 basis point
increase.
Selling, general and administrative expenses increased $48.8 million, or 17.7%, to $324.9 million in 2009
from $276.1 million in 2008. As a percentage of net revenues, selling, general and administrative expenses
decreased slightly to 37.9% in 2009 from 38.1% in 2008. These changes were primarily attributable to the
following:
• Marketing costs increased $12.8 million to $108.9 million in 2009 from $96.1 million in 2008
primarily due to increased sponsorships of collegiate and professional teams and new events, including
the National Football League Scouting Combine, and increased marketing costs for specific customers,
including our in-store brand campaign supporting the introduction of our performance running
footwear. These increases were partially offset by lower media and print expenditures in 2009. As a
32