Under Armour 2010 Annual Report Download - page 41
Download and view the complete annual report
Please find page 41 of the 2010 Under Armour annual report below. You can navigate through the pages in the report by either clicking on the pages listed below, or by using the keyword search tool below to find specific information within the annual report.-
 1
1 -
2
-
3
-
4
-
5
-
6
-
7
-
8
-
9
-
10
-
11
-
12
-
13
-
14
-
15
-
16
-
17
-
18
-
19
-
20
-
21
-
22
-
23
-
24
-
25
-
26
-
27
-
28
-
29
-
30
-
 31
31 -
 32
32 -
 33
33 -
 34
34 -
 35
35 -
 36
36 -
 37
37 -
 38
38 -
 39
39 -
 40
40 -
 41
41 -
 42
42 -
 43
43 -
 44
44 -
 45
45 -
 46
46 -
 47
47 -
 48
48 -
 49
49 -
 50
50 -
 51
51 -
52
-
53
-
54
-
55
-
56
-
57
-
58
-
59
-
60
-
61
-
62
-
63
-
64
-
65
-
66
-
67
-
68
-
69
-
70
-
71
-
72
-
73
-
74
-
75
-
76
-
77
-
78
-
79
-
80
-
81
-
82
-
83
-
84
-
85
-
86
-
87
-
88
-
89
-
90
-
91
-
92
 |
 |
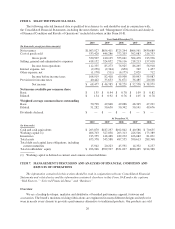
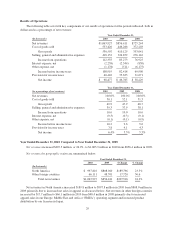
percentage of net revenues, marketing costs decreased to 12.7% in 2009 from 13.3% in 2008 primarily
due to lower media and print expenditures costs in 2009, partially offset by the other items noted
above.
• Selling costs increased $13.5 million to $69.6 million in 2009 from $56.1 million in 2008. This
increase was primarily due to costs incurred for the continued expansion of our direct to consumer
sales channel and higher personnel costs, including increased expenses for our performance incentive
plan as compared to the prior year. As a percentage of net revenues, selling costs increased to 8.1% in
2009 from 7.7% in 2008 due to increased costs incurred for the continued expansion of our factory
house stores, partially offset by decreased apparel selling personnel costs as a percentage of net
revenues.
• Product innovation and supply chain costs increased $13.4 million to $71.8 million in 2009 from $58.4
million in 2008 primarily due to higher personnel costs for the design and sourcing of our expanding
apparel and footwear lines, including increased expenses for our performance incentive plan as
compared to the prior year. In addition, this increase was due to higher distribution facilities operating
and personnel costs to support our growth. As a percentage of net revenues, product innovation and
supply chain costs increased to 8.4% in 2009 from 8.1% in 2008 due to the items noted above.
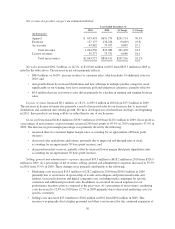
• Corporate services costs increased $9.1 million to $74.6 million in 2009 from $65.5 million in 2008.
This increase was attributable primarily to higher personnel costs for additional corporate personnel
necessary to support our growth, including increased expenses for our performance incentive plan as
compared to the prior year. In addition, this increase was due to higher company-wide stock-based
compensation and increased investments in consumer insight research. These increases were partially
offset by decreased allowances for bad debts during 2009. As a percentage of net revenues, corporate
services costs increased to 8.7% in 2009 from 9.0% in 2008 due to the items noted above.
Income from operations increased $8.4 million, or 10.9%, to $85.3 million in 2009 from $76.9 million in
2008. Income from operations as a percentage of net revenues decreased to 10.0% in 2009 from 10.6% in 2008.
This decrease was a result of a decrease in gross profit as a percentage of net revenues as discussed above.
Interest expense, net increased $1.4 million to $2.3 million in 2009 from $0.9 million in 2008. This increase
was primarily due to the write-off of deferred financing costs related to our prior revolving credit facility and
increased costs for our revolving credit facility during 2009.
Other expense, net decreased $5.7 million to $0.5 million in 2009 from $6.2 million in 2008. This change
was primarily due to our expanded foreign currency exchange hedging strategy in 2009 that reduced our
exposure associated with foreign currency exchange rate fluctuations primarily on intercompany transactions for
our European subsidiary in 2009 as compared to the prior year.
Provision for income taxes increased $3.9 million to $35.6 million in 2009 from $31.7 million in 2008. Our
effective tax rate was 43.2% in 2009 compared to 45.3% in 2008. The effective tax rate in 2009 was lower than
the effective tax rate in 2008 primarily due to decreased losses in our foreign subsidiaries and certain tax
planning strategies implemented during 2009.
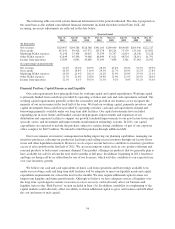
Seasonality
Historically, we have recognized a significant portion of our income from operations in the last two quarters
of the year, driven primarily by increased sales volume of our products during the fall selling season, reflecting
our historical strength in fall sports, and the seasonality of our higher priced COLDGEAR®line. Historically, a
larger portion of our income from operations has been in the last two quarters of the year partially due to the shift
in the timing of marketing investments to the first two quarters of the year. The majority of our net revenues were
generated during the last two quarters in each of 2010, 2009 and 2008. The level of our working capital generally
reflects the seasonality and growth in our business. We generally expect inventory, accounts payable and certain
accrued expenses to be higher in the second and third quarters in preparation for the fall selling season.
33