Under Armour 2010 Annual Report Download - page 76
Download and view the complete annual report
Please find page 76 of the 2010 Under Armour annual report below. You can navigate through the pages in the report by either clicking on the pages listed below, or by using the keyword search tool below to find specific information within the annual report.-
 1
1 -
2
-
3
-
4
-
5
-
6
-
7
-
8
-
9
-
10
-
11
-
12
-
13
-
14
-
15
-
16
-
17
-
18
-
19
-
20
-
21
-
22
-
23
-
24
-
25
-
26
-
27
-
28
-
29
-
30
-
31
-
32
-
33
-
34
-
35
-
36
-
37
-
38
-
39
-
40
-
41
-
42
-
43
-
44
-
45
-
46
-
47
-
48
-
49
-
50
-
51
-
52
-
53
-
54
-
55
-
56
-
57
-
58
-
59
-
60
-
61
-
62
-
63
-
64
-
65
-
 66
66 -
 67
67 -
 68
68 -
 69
69 -
 70
70 -
 71
71 -
 72
72 -
 73
73 -
 74
74 -
 75
75 -
 76
76 -
 77
77 -
 78
78 -
 79
79 -
 80
80 -
 81
81 -
 82
82 -
 83
83 -
 84
84 -
 85
85 -
 86
86 -
87
-
88
-
89
-
90
-
91
-
92
 |
 |

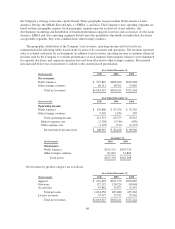
the Company’s strategy to become a global brand. These geographic regions include North America; Latin
America; Europe, the Middle East and Africa (“EMEA”); and Asia. The Company’s new operating segments are
based on these geographic regions. Each geographic segment operates exclusively in one industry: the
development, marketing and distribution of branded performance apparel, footwear and accessories. As the Latin
America, EMEA and Asia operating segments did not meet the quantitative thresholds for individual disclosure
as reportable segments, they were combined into other foreign countries.
The geographic distribution of the Company’s net revenues, operating income and total assets are
summarized in the following tables based on the location of its customers and operations. Net revenues represent
sales to external customers for each segment. In addition to net revenues, operating income is a primary financial
measure used by the Company to evaluate performance of each segment. Intercompany balances were eliminated
for separate disclosure and corporate expenses have not been allocated to other foreign countries. Prior period
data included below was reclassified to conform to the current period presentation.
(In thousands)
Year Ended December 31,
2010 2009 2008
Net revenues
North America $ 997,816 $808,020 $692,388
Other foreign countries 66,111 48,391 32,856
Total net revenues $1,063,927 $856,411 $725,244
(In thousands)
Year Ended December 31,
2010 2009 2008
Operating income
North America $ 102,806 $ 83,239 $ 76,326
Other foreign countries 9,549 2,034 599
Total operating income 112,355 85,273 76,925
Interest expense, net (2,258) (2,344) (850)
Other expense, net (1,178) (511) (6,175)
Income before income taxes $ 108,919 $ 82,418 $ 69,900
(In thousands)
December 31,
2010 2009
Total assets
North America $613,515 $493,726
Other foreign countries 61,863 51,862
Total assets $675,378 $545,588
Net revenues by product category are as follows:
(In thousands)
Year Ended December 31,
2010 2009 2008
Apparel $ 853,493 $651,779 $578,887
Footwear 127,175 136,224 84,848
Accessories 43,882 35,077 31,547
Total net sales 1,024,550 823,080 695,282
License revenues 39,377 33,331 29,962
Total net revenues $1,063,927 $856,411 $725,244
68