Ulta 2010 Annual Report Download - page 54
Download and view the complete annual report
Please find page 54 of the 2010 Ulta annual report below. You can navigate through the pages in the report by either clicking on the pages listed below, or by using the keyword search tool below to find specific information within the annual report.-
 1
1 -
2
-
3
-
4
-
5
-
6
-
7
-
8
-
9
-
10
-
11
-
12
-
13
-
14
-
15
-
16
-
17
-
18
-
19
-
20
-
21
-
22
-
23
-
24
-
25
-
26
-
27
-
28
-
29
-
30
-
31
-
32
-
33
-
34
-
35
-
36
-
37
-
38
-
39
-
40
-
41
-
42
-
43
-
 44
44 -
 45
45 -
 46
46 -
 47
47 -
 48
48 -
 49
49 -
 50
50 -
 51
51 -
 52
52 -
 53
53 -
 54
54 -
 55
55 -
 56
56 -
 57
57 -
 58
58 -
 59
59 -
 60
60 -
 61
61 -
 62
62 -
 63
63 -
 64
64 -
65
-
66
-
67
-
68
-
69
-
70
-
71
-
72
-
73
-
74
-
75
-
76
-
77
-
78
-
79
-
80
 |
 |

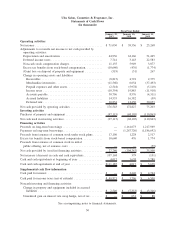
Ulta Salon, Cosmetics & Fragrance, Inc.
Statements of Cash Flows
(In thousands)
January 29,
2011
January 30,
2010
January 31,
2009
Fiscal Year Ended
Operating activities
Net income .......................................... $ 71,030 $ 39,356 $ 25,268
Adjustments to reconcile net income to net cash provided by
operating activities:
Depreciation and amortization .......................... 64,936 62,166 51,445
Deferred income taxes ................................ 7,741 3,143 22,583
Non-cash stock compensation charges..................... 11,155 5,949 3,877
Excess tax benefits from stock-based compensation........... (10,640) (476) (1,774)
(Gain) loss on disposal of property and equipment ........... (519) (51) 267
Change in operating assets and liabilities:
Receivables ...................................... (8,815) 4,791 2,375
Merchandise inventories ............................. (11,568) 6,654 (37,493)
Prepaid expenses and other assets ...................... (2,518) (5,978) (5,110)
Income taxes ..................................... (10,354) 19,885 (11,918)
Accounts payable .................................. 30,706 8,576 (4,311)
Accrued liabilities ................................. 14,535 16,382 (59)
Deferred rent ..................................... 20,854 12,430 30,053
Net cash provided by operating activities .................... 176,543 172,827 75,203
Investing activities
Purchases of property and equipment ....................... (97,115) (68,105) (110,863)
Net cash used in investing activities ........................ (97,115) (68,105) (110,863)
Financing activities
Proceeds on long-term borrowings ......................... — 1,161,673 1,217,969
Payments on long-term borrowings......................... — (1,267,720) (1,186,692)
Proceeds from issuance of common stock under stock plans ...... 17,100 1,228 2,517
Excess tax benefits from stock-based compensation ............ 10,640 476 1,774
Proceeds from issuance of common stock in initial
public offering, net of issuance costs ..................... — — (59)
Net cash provided by (used in) financing activities ............. 27,740 (104,343) 35,509
Net increase (decrease) in cash and cash equivalents ............ 107,168 379 (151)
Cash and cash equivalents at beginning of year ............... 4,017 3,638 3,789
Cash and cash equivalents at end of year .................... $111,185 $ 4,017 $ 3,638
Supplemental cash flow information
Cash paid for interest................................... $ — $ 2,440 $ 4,764
Cash paid for income taxes (net of refunds) .................. $ 49,871 $ 3,706 $ 6,509
Noncash investing and financing activities:
Change in property and equipment included in accrued
liabilities ........................................ $ 2,540 $ (7,353) $ (3,316)
Unrealized gain on interest rate swap hedge, net of tax ........ $ — $ 631 $ 88
See accompanying notes to financial statements.
50