Ulta 2010 Annual Report Download - page 2
Download and view the complete annual report
Please find page 2 of the 2010 Ulta annual report below. You can navigate through the pages in the report by either clicking on the pages listed below, or by using the keyword search tool below to find specific information within the annual report.-
 1
1 -
 2
2 -
 3
3 -
 4
4 -
 5
5 -
 6
6 -
 7
7 -
 8
8 -
 9
9 -
 10
10 -
 11
11 -
 12
12 -
 13
13 -
14
-
15
-
16
-
17
-
18
-
19
-
20
-
21
-
22
-
23
-
24
-
25
-
26
-
27
-
28
-
29
-
30
-
31
-
32
-
33
-
34
-
35
-
36
-
37
-
38
-
39
-
40
-
41
-
42
-
43
-
44
-
45
-
46
-
47
-
48
-
49
-
50
-
51
-
52
-
53
-
54
-
55
-
56
-
57
-
58
-
59
-
60
-
61
-
62
-
63
-
64
-
65
-
66
-
67
-
68
-
69
-
70
-
71
-
72
-
73
-
74
-
75
-
76
-
77
-
78
-
79
-
80
 |
 |

Net sales(2)
Cost of sales(3)
Gross profit
Selling, general & administrative expenses(3)
Pre-opening expenses
Operating income
Interest expense
Income before income taxes
Income tax expense
Net income
Net income per common share:
Basic
Diluted
Comparable store sales increase(4)
Number of stores end of year
Net sales per average total square foot(5)
Capital expenditures
Depreciation and amortization
Cash and cash equivalents
Working capital
Property and equipment, net
Total assets
Total debt
Total stockholders' equity
FISCAL YEAR ENDED (1)
January 29, 2011
$
1,454,838
970,753
484,085
358,106
7,095
118,884
755
118,129
47,099
$ 71,030
$ 1.20
$ 1.16
11.0%
389
$
382
97,115
64,936
$
111,185
241,032
326,099
730,488
–
402,533
January 30, 2010
$
1,222,771
846,202
376,569
302,413
6,003
68,153
2,202
65,951
26,595
$ 39,356
$
0.68
$
0.66
1.4%
346
$
353
68,105
62,166
$
4,017
136,417
290,861
553,635
–
292,608
January 31, 2009
$ 1,084,646
752,939
331,707
271,095
14,311
46,301
3,943
42,358
17,090
$
25,268
$ 0.44
$ 0.43
0.2%
311
$ 366
110,863
51,445
$
3,638
159,695
292,224
568,932
106,047
244,968
February 2, 2008
$
912,141
628,495
283,646
225,167
11,758
46,721
4,542
42,179
16,844
$ 25,335
$ 0.69
$ 0.48
6.4%
249
$ 399
101,866
39,503
$
3,789
117,039
236,389
469,413
74,770
211,503
February 3, 2007
$
755,113
519,929
235,184
188,000
7,096
40,088
3,314
36,774
14,231
$ 22,543
$ 1.38
$ 0.45
14.5%
196
$ 398
62,331
29,736
$
3,645
88,105
162,080
338,597
55,529
148,760
(1) Our fiscal year-end is the Saturday closest to January 31 based on a 52/53-week year. Each fiscal year consists of four 13-week quarters, with an extra week added onto the fourth quarter
every five or six years.
(2) Fiscal 2006 was a 53-week operating year and the 53rd week represented approximately $16.4 million in net sales.
(3) The Company made reclassifications in the consolidated income statements for the fiscal years ended January 30, 2010 (fiscal 2009) and January 31, 2009 (fiscal 2008) to decrease cost
of sales and increase selling, general and administrative expenses by $3,520 and $3,773, respectively, to conform to the fiscal 2010 presentation. Amounts were insignificant for fiscal 2007
and 2006.
(4) Comparable store sales increase reflects sales for stores beginning on the first day of the 14th month of operation. Remodeled stores are included in comparable store sales unless the
store was closed for a portion of the current or comparable prior year.
(5) Net sales per average total square foot was calculated by dividing net sales for the year by the average square footage for those stores open during each year. Fiscal 2006 net sales per
average total square foot were adjusted to exclude the net sales effect of the 53rd week.
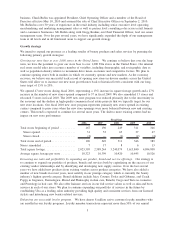
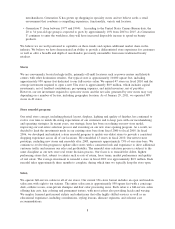
INCOME STATEMENT:
(IN THOUSANDS, EXCEPT PER SHARE AND PER SQUARE FOOT DATA)
OTHER OPERATING DATA:
BALANCE SHEET DATA:
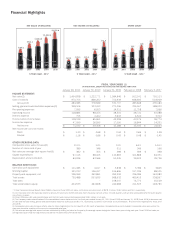
2006 2007 2008 2009 2010
$1,454.8
$1,222.8
$1,084.6
$912.1
$755.1
30% 21% 13% 19%19%
NET SALES (IN MILLIONS)
5 YEAR CAGR - 20%*
2006 2007 2008 2009 2010
NET INCOME (IN MILLIONS)
5 YEAR CAGR - 35%*
2006 2007 2008 2009 2010
STORE COUNT
5 YEAR CAGR - 18%*
* 5-Year Compound Annual Growth Rate (CAGR) is based on fiscal 2005 net sales, net income and store count of $579.1 million, $16.0 million and 167, respectively.
$71.0
$39.4
$25.3$25.3
$22.5
41% 56% 80%0%
389
346
311
249
196
17% 27% 11% 12%25%
12%
Net sales(2)
Cost of sales(3)
Gross profit
Selling, general & administrative expenses(3)
Pre-opening expenses
Operating income
Interest expense
Income before income taxes
Income tax expense
Net income
Net income per common share:
Basic
Diluted
Comparable store sales increase(4)
Number of stores end of year
Net sales per average total square foot(5)
Capital expenditures
Depreciation and amortization
Cash and cash equivalents
Working capital
Property and equipment, net
Total assets
Total debt
Total stockholders' equity
FISCAL YEAR ENDED (1)
January 29, 2011
$ 1,454,838
970,753
484,085
358,106
7,095
118,884
755
118,129
47,099
$ 71,030
$ 1.20
$ 1.16
11.0%
389
$ 382
97,115
64,936
$ 111,185
241,032
326,099
730,488
–
402,533
January 30, 2010
$ 1,222,771
846,202
376,569
302,413
6,003
68,153
2,202
65,951
26,595
$ 39,356
$ 0.68
$ 0.66
1.4%
346
$ 353
68,105
62,166
$ 4,017
136,417
290,861
553,635
–
292,608
January 31, 2009
$ 1,084,646
752,939
331,707
271,095
14,311
46,301
3,943
42,358
17,090
$ 25,268
$ 0.44
$ 0.43
0.2%
311
$ 366
110,863
51,445
$ 3,638
159,695
292,224
568,932
106,047
244,968
February 2, 2008
$ 912,141
628,495
283,646
225,167
11,758
46,721
4,542
42,179
16,844
$ 25,335
$ 0.69
$ 0.48
6.4%
249
$ 399
101,866
39,503
$ 3,789
117,039
236,389
469,413
74,770
211,503
February 3, 2007
$ 755,113
519,929
235,184
188,000
7,096
40,088
3,314
36,774
14,231
$ 22,543
$ 1.38
$ 0.45
14.5%
196
$ 398
62,331
29,736
$ 3,645
88,105
162,080
338,597
55,529
148,760
(1) Our fiscal year-end is the Saturday closest to January 31 based on a 52/53-week year. Each fiscal year consists of four 13-week quarters, with an extra week added onto the fourth quarter
every five or six years.
(2) Fiscal 2006 was a 53-week operating year and the 53rd week represented approximately $16.4 million in net sales.
(3) The Company made reclassifications in the consolidated income statements for the fiscal years ended January 30, 2010 (fiscal 2009) and January 31, 2009 (fiscal 2008) to decrease cost
of sales and increase selling, general and administrative expenses by $3,520 and $3,773, respectively, to conform to the fiscal 2010 presentation. Amounts were insignificant for fiscal 2007
and 2006.
(4) Comparable store sales increase reflects sales for stores beginning on the first day of the 14th month of operation. Remodeled stores are included in comparable store sales unless the
store was closed for a portion of the current or comparable prior year.
(5) Net sales per average total square foot was calculated by dividing net sales for the year by the average square footage for those stores open during each year. Fiscal 2006 net sales per
average total square foot were adjusted to exclude the net sales effect of the 53rd week.
INCOME STATEMENT:
(IN THOUSANDS, EXCEPT PER SHARE AND PER SQUARE FOOT DATA)
OTHER OPERATING DATA:
BALANCE SHEET DATA:
* 5-Year Compound Annual Growth Rate (CAGR) is based on fiscal 2005 net sales, net income and store count of $579.1 million, $16.0 million and 167, respectively.
2006 2007 2008 2009 2010
$1,454.8
$1,222.8
$1,084.6
$912.1
$755.1
30% 21% 13% 19%19%
NET SALES (IN MILLIONS)
5 YEAR CAGR - 20%*
2006 2007 2008 2009 2010
NET INCOME (IN MILLIONS)
5 YEAR CAGR - 35%*
2006 2007 2008 2009 2010
STORE COUNT
5 YEAR CAGR - 18%*
$71.0
$39.4
$25.3$25.3
$22.5
41% 56% 80%
389
346
311
249
196
17% 27% 11% 12%25%
12% 0%
Financial Highlights