Ulta 2010 Annual Report Download - page 40
Download and view the complete annual report
Please find page 40 of the 2010 Ulta annual report below. You can navigate through the pages in the report by either clicking on the pages listed below, or by using the keyword search tool below to find specific information within the annual report.-
 1
1 -
2
-
3
-
4
-
5
-
6
-
7
-
8
-
9
-
10
-
11
-
12
-
13
-
14
-
15
-
16
-
17
-
18
-
19
-
20
-
21
-
22
-
23
-
24
-
25
-
26
-
27
-
28
-
29
-
 30
30 -
 31
31 -
 32
32 -
 33
33 -
 34
34 -
 35
35 -
 36
36 -
 37
37 -
 38
38 -
 39
39 -
 40
40 -
 41
41 -
 42
42 -
 43
43 -
 44
44 -
 45
45 -
 46
46 -
 47
47 -
 48
48 -
 49
49 -
 50
50 -
51
-
52
-
53
-
54
-
55
-
56
-
57
-
58
-
59
-
60
-
61
-
62
-
63
-
64
-
65
-
66
-
67
-
68
-
69
-
70
-
71
-
72
-
73
-
74
-
75
-
76
-
77
-
78
-
79
-
80
 |
 |

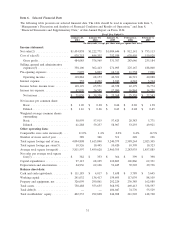
As of January 29, 2011, we operated 389 stores across 40 states. The following tables present the components
of our results of operations for the periods indicated:
January 29,
2011
January 30,
2010
January 31,
2009
Fiscal Year Ended
(In thousands, except number of stores)
Netsales..................................... $1,454,838 $1,222,771 $1,084,646
Cost of sales(1) ................................ 970,753 846,202 752,939
Gross profit ................................. 484,085 376,569 331,707
Selling, general and administrative expenses(1) ......... 358,106 302,413 271,095
Pre-opening expenses ............................ 7,095 6,003 14,311
Operating income ............................. 118,884 68,153 46,301
Interest expense ................................ 755 2,202 3,943
Income before income taxes ..................... 118,129 65,951 42,358
Income tax expense ............................. 47,099 26,595 17,090
Net income ................................. $ 71,030 $ 39,356 $ 25,268
Other operating data:
Number of stores end of period .................... 389 346 311
Comparable store sales increase .................... 11.0% 1.4% 0.2%
(Percentage of Net Sales)
January 29,
2011
January 30,
2010
January 31,
2009
Fiscal Year Ended
Netsales ....................................... 100.0% 100.0% 100.0%
Cost of sales .................................... 66.7% 69.2% 69.4%
Gross profit . . . ................................ 33.3% 30.8% 30.6%
Selling, general and adminstrative expenses.............. 24.6% 24.7% 25.0%
Pre-opening expenses .............................. 0.5% 0.5% 1.3%
Operating income ............................... 8.2% 5.6% 4.3%
Interest expense . . ................................ 0.1% 0.2% 0.4%
Income before income taxes ....................... 8.1% 5.4% 3.9%
Income tax expense ............................... 3.2% 2.2% 1.6%
Net income.................................... 4.9% 3.2% 2.3%
(1) The Company made reclassifications in the consolidated income statements for the fiscal years ended
January 30, 2010 (fiscal 2009) and January 31, 2009 (fiscal 2008) to decrease cost of sales and increase
selling, general and administrative expenses by $3,520 and $3,773, respectively, to conform to the fiscal
2010 presentation.
Fiscal year 2010 versus fiscal year 2009
Net sales
Net sales increased $232.0 million, or 19.0%, to $1,454.8 million in fiscal 2010 compared to $1,222.8 million
in fiscal 2009. Salon service sales increased $9.8 million, or 12.8%, to $86.4 million compared to
$76.6 million in fiscal 2009. The sales increases are due to the opening of 43 net new stores in 2010 and a
11.0% increase in comparable store sales which was primarily due to a 8.6% increase in store traffic. Non-
comparable stores, which include stores opened in fiscal 2010 as well as stores opened in fiscal 2009 which
36