Ubisoft 2001 Annual Report Download - page 74
Download and view the complete annual report
Please find page 74 of the 2001 Ubisoft annual report below. You can navigate through the pages in the report by either clicking on the pages listed below, or by using the keyword search tool below to find specific information within the annual report.-
 1
1 -
2
-
3
-
4
-
5
-
6
-
7
-
8
-
9
-
10
-
11
-
12
-
13
-
14
-
15
-
16
-
17
-
18
-
19
-
20
-
21
-
22
-
23
-
24
-
25
-
26
-
27
-
28
-
29
-
30
-
31
-
32
-
33
-
34
-
35
-
36
-
37
-
38
-
39
-
40
-
41
-
42
-
43
-
44
-
45
-
46
-
47
-
48
-
49
-
50
-
51
-
52
-
53
-
54
-
55
-
56
-
57
-
58
-
59
-
60
-
61
-
62
-
63
-
 64
64 -
 65
65 -
 66
66 -
 67
67 -
 68
68 -
 69
69 -
 70
70 -
 71
71 -
 72
72 -
 73
73 -
 74
74 -
 75
75 -
 76
76 -
 77
77 -
 78
78 -
 79
79 -
 80
80 -
 81
81 -
 82
82 -
 83
83 -
 84
84 -
85
-
86
-
87
-
88
-
89
-
90
-
91
-
92
-
93
-
94
-
95
-
96
-
97
-
98
-
99
-
100
-
101
-
102
-
103
-
104
-
105
-
106
-
107
-
108
-
109
-
110
-
111
-
112
-
113
-
114
-
115
-
116
-
117
-
118
-
119
-
120
-
121
-
122
-
123
-
124
 |
 |

74
On 03.31.01 On 03.31.02
Cumulative Increase Decrease Cumulative
Equity holdings 2,478 113 2,933* 1,592
Loans / / 453 /
Total 2,478 113 3,386 1,592
* Provisions essentially relate to Teamchman Inc. shares for M 1,9.
Provisions
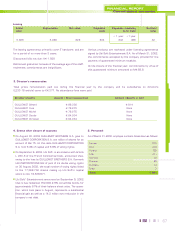
III. FINANCIAL ASSETS
Financial assets break down as follows:
On 03.31.01 On 03.31.02
Gross Increase Decrease Gross
Equity holdings 164,893 55,215 107,100 113,008
Other fixed investments 4 / / 4
Loans / 10,991 / 10,991
Deposits and guarantees 235 169 11 393
Total 165,132 66,375 107,111 124,396
IV. INVENTORY AND WORK-IN-PROGRESS
Inventory and work-in-progress break down as follows:
V. ADVANCES AND INSTALLMENTS PAID
These are primarily guaranteed advances paid on licensing
contracts totaling K 53,431.
These advances are taken to earnings in proportion to sales
made of the licensed products.
On 03.31.02 On 03.31.01
Gross Provisions Net Net
Goods 15,904 792 15,112 18,465
Total 15,904 792 15,112 18,465
Tangible fixed assets
The increase in equity holdings is primarily the result of the
equity issues by Ubi Soft Inc. (San Francisco) and Ubi Holding
Inc., totaling M 14,3 and M 21,8 respectively.
The reduction equity holdings is due to the merger between
Ubi Soft Entertainment S.A. and Ubi Ventures S.A, together
with the transfer of Blue Byte GmbH shares to Ubi Soft GmbH.
The increase in inventory is linked to the growth in business and the releasing of products during the last month of the
finan
cial year.