Ubisoft 2001 Annual Report Download - page 4
Download and view the complete annual report
Please find page 4 of the 2001 Ubisoft annual report below. You can navigate through the pages in the report by either clicking on the pages listed below, or by using the keyword search tool below to find specific information within the annual report.-
 1
1 -
 2
2 -
 3
3 -
 4
4 -
 5
5 -
 6
6 -
 7
7 -
 8
8 -
 9
9 -
 10
10 -
 11
11 -
 12
12 -
 13
13 -
 14
14 -
 15
15 -
16
-
17
-
18
-
19
-
20
-
21
-
22
-
23
-
24
-
25
-
26
-
27
-
28
-
29
-
30
-
31
-
32
-
33
-
34
-
35
-
36
-
37
-
38
-
39
-
40
-
41
-
42
-
43
-
44
-
45
-
46
-
47
-
48
-
49
-
50
-
51
-
52
-
53
-
54
-
55
-
56
-
57
-
58
-
59
-
60
-
61
-
62
-
63
-
64
-
65
-
66
-
67
-
68
-
69
-
70
-
71
-
72
-
73
-
74
-
75
-
76
-
77
-
78
-
79
-
80
-
81
-
82
-
83
-
84
-
85
-
86
-
87
-
88
-
89
-
90
-
91
-
92
-
93
-
94
-
95
-
96
-
97
-
98
-
99
-
100
-
101
-
102
-
103
-
104
-
105
-
106
-
107
-
108
-
109
-
110
-
111
-
112
-
113
-
114
-
115
-
116
-
117
-
118
-
119
-
120
-
121
-
122
-
123
-
124
 |
 |

4
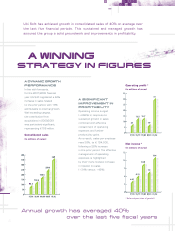
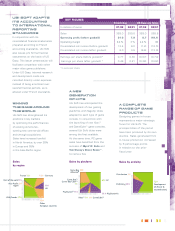
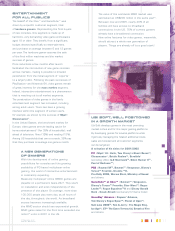
A WINNING
STRATEGY IN FIGURES
Annual growth has averaged 40%
over the last five fiscal years
AA SSIIGGNNIIFFIICCAANNTT
IIMMPPRROOVVEEMMEENNTT IINN
PPRROOFFIITTAABBIILLIITTYY
Operating income surged
(+292%) in response to
sustained growth in sales
combined with effective
containment of operating
expenses and further
productivity gains.
As a result, sales per employee
rose 38%, to 194,000,
following a 26% increase
in the prior period. The effective
management of operating
expenses is highlighted
by their more modest increase
in relation to sales
(+34% versus +42%).
Operating profit *
(in millions of euros)
Net income *
(in millions of euros)
* Before depreciation of goodwill.
0
97/98 98/99 99/00 00/01 01/02
5
10
15
20
25
30
35
8.1
13.5 13.7
7.9
31
0
3
6
9
1
2
1
5
97/98 98/99 99/00 00/01 01/02
4.41
6.31
10.9
7.9
13.4
Ubi Soft has achieved growth in consolidated sales of 40% on average over
the last five financial periods. This sustained and managed growth has
assured the group a solid groundwork and improvements in profitability.
AA DDYYNNAAMMIICC GGRROOWWTTHH
PPEERRFFOORRMMAANNCCEE
In line with forecasts,
for the 2001/2002 financial
year Ubi Soft registered a 42%
increase in sales related
to the prior period, with 18%
attributable to internal growth.
Well exceeding targets,
the contribution from
acquisitions in 2000/2001
was particularly significant,
representing 108 million.
Consolidated sales
(in millions of euros)
0
50
100
150
200
250
300
350
400
97/98 98/99 99/00 00/01 01/02
96.4
132.6
186.5
259.8
369