Ubisoft 2001 Annual Report Download - page 63
Download and view the complete annual report
Please find page 63 of the 2001 Ubisoft annual report below. You can navigate through the pages in the report by either clicking on the pages listed below, or by using the keyword search tool below to find specific information within the annual report.-
 1
1 -
2
-
3
-
4
-
5
-
6
-
7
-
8
-
9
-
10
-
11
-
12
-
13
-
14
-
15
-
16
-
17
-
18
-
19
-
20
-
21
-
22
-
23
-
24
-
25
-
26
-
27
-
28
-
29
-
30
-
31
-
32
-
33
-
34
-
35
-
36
-
37
-
38
-
39
-
40
-
41
-
42
-
43
-
44
-
45
-
46
-
47
-
48
-
49
-
50
-
51
-
52
-
 53
53 -
 54
54 -
 55
55 -
 56
56 -
 57
57 -
 58
58 -
 59
59 -
 60
60 -
 61
61 -
 62
62 -
 63
63 -
 64
64 -
 65
65 -
 66
66 -
 67
67 -
 68
68 -
 69
69 -
 70
70 -
 71
71 -
 72
72 -
 73
73 -
74
-
75
-
76
-
77
-
78
-
79
-
80
-
81
-
82
-
83
-
84
-
85
-
86
-
87
-
88
-
89
-
90
-
91
-
92
-
93
-
94
-
95
-
96
-
97
-
98
-
99
-
100
-
101
-
102
-
103
-
104
-
105
-
106
-
107
-
108
-
109
-
110
-
111
-
112
-
113
-
114
-
115
-
116
-
117
-
118
-
119
-
120
-
121
-
122
-
123
-
124
 |
 |

FINANCIAL REPORT
Consolidated accounts
63
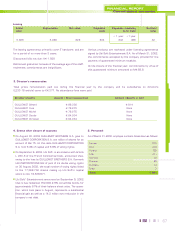
Geographic breakdown of assets :
3.1.4.4 Notes on the income statement
I. SALES
Breakdown of sales by geographical area:
Breakdown of sales by activity:
Assets in K
Great Rest of United-States 03.31.02
France Germany Britain Europe Canada ROW Total
(net values)
Goodwill/Business assets/Trademarks 25,347 11,816 3,053 69,629 2,125 111,970
Intangible,assets 150,906 138 214 10,953 1,092 163,303
Tangible assets 5,361 198 252 816 1,428 5,298 13,353
Financial assets 19,788 42 120 125 41 380 20,496
Fixed assets 201,402 12,194 372 4,208 82,051 8,896 309,122
Inventory,and work-in-progress 15,112 4,974 7,635 8,264 10,255 2,405 48,645
Advances and installments paid 53,548 1,056 324 1 102 66 55,097
Trade receivables 28,882 16,440 19,095 16,731 23,440 1,890 106,478
Other receivables, prepayments and deferred income 41,310 1,356 1,661 1,872 15,154 8,823 70,176
Investment securities 40,365 40,365
Cash 6,128 5,215 2,461 2,520 8,310 5,914 30,548
Current assets 185,345 29,041 31,176 29,389 57,260 19,098 351,309
Total assets 386,747 41,234 31,548 33,597 139,311 27,994 351,309
03.31.
02
03.31.
01
K%K%
Germany 43,892 12% 34,887 13%
GB 41,458 11% 34,048 13%
Scandinavia 13,230 4% 14,638 6%
Italy 16,030 4% 13,130 5%
France 67,975 19% 61,127 24%
Other European Countries 29,775 8% 18,246 7%
USA 137,955 37% 69,406 27%
Rest of the world 18,646 5% 14,333 5%
Total 368,961 100% 259,815 100%
03.31.
02
03.31.
01
K%K%
Distribution 18,448 5% 8,470 3%
Development 265,652 72% 170,828 66%
Publishing 84,861 23% 80,517 31%
Total 368,961 100% 259,815 100%