Toyota 2012 Annual Report Download - page 78
Download and view the complete annual report
Please find page 78 of the 2012 Toyota annual report below. You can navigate through the pages in the report by either clicking on the pages listed below, or by using the keyword search tool below to find specific information within the annual report.-
 1
1 -
2
-
3
-
4
-
5
-
6
-
7
-
8
-
9
-
10
-
11
-
12
-
13
-
14
-
15
-
16
-
17
-
18
-
19
-
20
-
21
-
22
-
23
-
24
-
25
-
26
-
27
-
28
-
29
-
30
-
31
-
32
-
33
-
34
-
35
-
36
-
37
-
38
-
39
-
40
-
41
-
42
-
43
-
44
-
45
-
46
-
47
-
48
-
49
-
50
-
51
-
52
-
53
-
54
-
55
-
56
-
57
-
58
-
59
-
60
-
61
-
62
-
63
-
64
-
65
-
66
-
67
-
 68
68 -
 69
69 -
 70
70 -
 71
71 -
 72
72 -
 73
73 -
 74
74 -
 75
75 -
 76
76 -
 77
77 -
 78
78 -
 79
79 -
 80
80 -
 81
81 -
 82
82 -
 83
83 -
 84
84 -
 85
85 -
 86
86 -
 87
87 -
 88
88 -
89
-
90
-
91
-
92
-
93
-
94
-
95
-
96
-
97
-
98
-
99
-
100
-
101
-
102
-
103
-
104
-
105
-
106
-
107
-
108
-
109
-
110
-
111
-
112
-
113
-
114
-
115
-
116
-
117
-
118
-
119
-
120
-
121
-
122
-
123
-
124
-
125
-
126
-
127
 |
 |
TOYOTA ANNUAL REPORT 2012
Toyota Global Vision Changes for Making
Ever-Better Cars President
ʼ
s Message Medium- to Long-Term
Growth Initiatives Special Feature Management and
Corporate Information Investor Information
Business and
Performance Review Financial Section
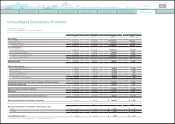
Consolidated Statements of Income
Toyota Motor Corporation
For the years ended March 31, 2010, 2011 and 2012
The accompanying notes are an integral part of these consolidated financial statements.
Yen in millions U.S. dollars in millions
2010 2011 2012 2012
Net revenues
Sales of products ¥ 17,724,729 ¥17,820,520 ¥ 17,511,916 $ 213,066
Financing operations 1,226,244 1,173,168 1,071,737 13,040
Total net revenues 18,950,973 18,993,688 18,583,653 226,106
Costs and expenses
Cost of products sold 15,971,496 15,985,783 15,795,918 192,188
Cost of financing operations 712,301 629,543 592,646 7,211
Selling, general and administrative 2,119,660 1,910,083 1,839,462 22,380
Total costs and expenses 18,803,457 18,525,409 18,228,026 221,779
Operating income 147,516 468,279 355,627 4,327
Other income
(
expense
)
Interest and dividend income 78,224 90,771 99,865 1,215
Interest expense
(
33,409
) (
29,318
)(
22,922
)(
279
)
Foreign exchange gain, net 68,251 14,305 37,105 452
Other income
(
loss
)
, net 30,886 19,253
(
36,802
)(
448
)
Total other income
(
expense
)
143,952 95,011 77,246 940
Income before income taxes and equity in earnings of affiliated companies 291,468 563,290 432,873 5,267
Provision for income taxes 92,664 312,821 262,272 3,191
Equity in earnings of affiliated companies 45,408 215,016 197,701 2,405
Net income 244,212 465,485 368,302 4,481
Less: Net income attributable to noncontrolling interests
(
34,756
) (
57,302
)(
84,743
)(
1,031
)
Net income attributable to Toyota Motor Corporation ¥ 209,456 ¥ 408,183 ¥ 283,559 $ 3,450
Yen U.S. dollars
Net income attributable to Toyota Motor Corporation per share
ー
Basic ¥ 66.79 ¥ 130.17 ¥ 90.21 $ 1.10
ー
Diluted ¥ 66.79 ¥ 130.16 ¥ 90.20 $ 1.10
Cash dividends per share ¥ 45.00 ¥ 50.00 ¥ 50.00 $ 0.61
0820
Search NextPrev page 78
Contents