Toyota 2012 Annual Report Download - page 122
Download and view the complete annual report
Please find page 122 of the 2012 Toyota annual report below. You can navigate through the pages in the report by either clicking on the pages listed below, or by using the keyword search tool below to find specific information within the annual report.-
 1
1 -
2
-
3
-
4
-
5
-
6
-
7
-
8
-
9
-
10
-
11
-
12
-
13
-
14
-
15
-
16
-
17
-
18
-
19
-
20
-
21
-
22
-
23
-
24
-
25
-
26
-
27
-
28
-
29
-
30
-
31
-
32
-
33
-
34
-
35
-
36
-
37
-
38
-
39
-
40
-
41
-
42
-
43
-
44
-
45
-
46
-
47
-
48
-
49
-
50
-
51
-
52
-
53
-
54
-
55
-
56
-
57
-
58
-
59
-
60
-
61
-
62
-
63
-
64
-
65
-
66
-
67
-
68
-
69
-
70
-
71
-
72
-
73
-
74
-
75
-
76
-
77
-
78
-
79
-
80
-
81
-
82
-
83
-
84
-
85
-
86
-
87
-
88
-
89
-
90
-
91
-
92
-
93
-
94
-
95
-
96
-
97
-
98
-
99
-
100
-
101
-
102
-
103
-
104
-
105
-
106
-
107
-
108
-
109
-
110
-
111
-
 112
112 -
 113
113 -
 114
114 -
 115
115 -
 116
116 -
 117
117 -
 118
118 -
 119
119 -
 120
120 -
 121
121 -
 122
122 -
 123
123 -
 124
124 -
 125
125 -
 126
126 -
 127
127
 |
 |
TOYOTA ANNUAL REPORT 2012
Toyota Global Vision Changes for Making
Ever-Better Cars President
ʼ
s Message Medium- to Long-Term
Growth Initiatives Special Feature Management and
Corporate Information Investor Information
Business and
Performance Review Financial Section
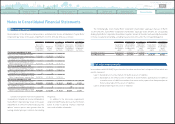
Notes to Consolidated Financial Statements
These assets are classified in Level 2. During the
year ended March 31, 2012, certain government
bonds were transferred from in Level 1 to Level
2 due to the lack of quoted prices for identical
assets traded in an active market.
See note 20 to the consolidated financial
statements about derivative financial instruments.
Toyota estimates the fair value of derivative
financial instruments using industry-standard
valuation models that require observable inputs
including interest rates and foreign exchange
rates, and the contractual terms. The usage
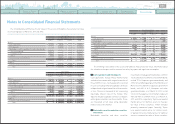
The following table summarizes the changes in Level 3 assets and liabilities measured at fair value
on a recurring basis for the periods ended March 31, 2010, 2011 and 2012:
of these models does not require significant
judgment to be applied. These derivative financial
instruments are classified in Level 2. In other
certain cases when market data is not available,
key inputs to the fair value measurement include
quotes from counterparties, and other market
data. Toyota assesses the reasonableness of
changes of the quotes using observable market
data. These derivative financial instruments are
classified in Level 3. Toyota
ʼ
s derivative fair value
measurements consider assumptions about
counterparty and our own non-performance risk,
using such as credit default probabilities.
■
Derivative financial instruments
Yen in millions
For the year ended March 31, 2010
Marketable
securities and
other securities
investments
Derivative
financial
instruments Total
Balance at beginning of year ¥ 19,581 ¥
(
5,734
)
¥ 13,847
Total gains
(
losses
)
Included in earnings
(
641
)
25,057 24,416
Included in other comprehensive income
(
loss
) (
99
)—
(
99
)
Purchases, issuances and settlements
(
6,376
) (
13,582
) (
19,958
)
Other 669 151 820
Balance at end of year ¥ 13,134 ¥ 5,892 ¥ 19,026
Yen in millions
For the year ended March 31, 2011
Marketable
securities and
other securities
investments
Derivative
financial
instruments Total
Balance at beginning of year ¥ 13,134 ¥ 5,892 ¥ 19,026
Total gains
(
losses
)
Included in earnings 433 31,338 31,771
Included in other comprehensive income 779
—
779
Purchases, issuances and settlements
(
810
) (
8,381
) (
9,191
)
Other
(
13,536
) (
22,055
) (
35,591
)
Balance at end of year ¥
—
¥ 6,794 ¥ 6,794
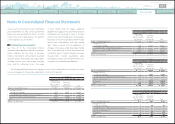
Yen in millions
For the year ended March 31, 2012
Marketable
securities and
other securities
investments
Derivative
financial
instruments Total
Balance at beginning of year ¥
̶
¥ 6,794 ¥ 6,794
Total gains
(
losses
)
Included in earnings
̶
6,476 6,476
Included in other comprehensive income
(
loss
)̶
̶
̶
Purchases and issuances
̶
̶
̶
Settlements
̶
(
3,832
) (
3,832
)
Other 1,684
(
4,699
) (
3,015
)
Balance at end of year ¥1,684 ¥ 4,739 ¥ 6,423
U.S. dollars in millions
For the year ended March 31, 2012
Marketable
securities and
other securities
investments
Derivative
financial
instruments Total
Balance at beginning of year $
̶
$ 83 $ 83
Total gains
(
losses
)
Included in earnings
̶
78 78
Included in other comprehensive income
(
loss
)̶
̶
̶
Purchases and issuances
̶
̶
̶
Settlements
̶
(
47
) (
47
)
Other 21
(
57
) (
36
)
Balance at end of year $ 21 $ 57 $ 78
0820
Search NextPrev page 122
Contents