Toyota 2012 Annual Report Download - page 62
Download and view the complete annual report
Please find page 62 of the 2012 Toyota annual report below. You can navigate through the pages in the report by either clicking on the pages listed below, or by using the keyword search tool below to find specific information within the annual report.-
 1
1 -
2
-
3
-
4
-
5
-
6
-
7
-
8
-
9
-
10
-
11
-
12
-
13
-
14
-
15
-
16
-
17
-
18
-
19
-
20
-
21
-
22
-
23
-
24
-
25
-
26
-
27
-
28
-
29
-
30
-
31
-
32
-
33
-
34
-
35
-
36
-
37
-
38
-
39
-
40
-
41
-
42
-
43
-
44
-
45
-
46
-
47
-
48
-
49
-
50
-
51
-
 52
52 -
 53
53 -
 54
54 -
 55
55 -
 56
56 -
 57
57 -
 58
58 -
 59
59 -
 60
60 -
 61
61 -
 62
62 -
 63
63 -
 64
64 -
 65
65 -
 66
66 -
 67
67 -
 68
68 -
 69
69 -
 70
70 -
 71
71 -
 72
72 -
73
-
74
-
75
-
76
-
77
-
78
-
79
-
80
-
81
-
82
-
83
-
84
-
85
-
86
-
87
-
88
-
89
-
90
-
91
-
92
-
93
-
94
-
95
-
96
-
97
-
98
-
99
-
100
-
101
-
102
-
103
-
104
-
105
-
106
-
107
-
108
-
109
-
110
-
111
-
112
-
113
-
114
-
115
-
116
-
117
-
118
-
119
-
120
-
121
-
122
-
123
-
124
-
125
-
126
-
127
 |
 |

TOYOTA ANNUAL REPORT 2012
Toyota Global Vision Changes for Making
Ever-Better Cars President
ʼ
s Message Medium- to Long-Term
Growth Initiatives Special Feature Management and
Corporate Information Investor Information
Business and
Performance Review Financial Section
Management's Discussion and Analysis of Financial Condition and Results of Operations
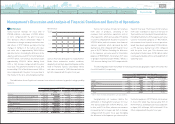
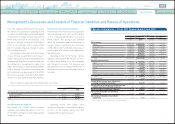
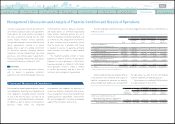
The following is a discussion of net revenues in each geographic market
(
before the elimination of
intersegment revenues
)
.
Japan
Thousands of units
Year ended March 31, 2011 vs. 2010 Change
2010 2011 Amount Percentage
Toyota
ʼ
s consolidated vehicle unit sales 2,163 1,913
(
250
)
-
11.5%
Yen in millions
Year ended March 31, 2011 vs. 2010 Change
2010 2011 Amount Percentage
Net revenues:
Sales of products ¥ 11,095,044 ¥ 10,864,329 ¥
(
230,715
)
-
2.1%
Financial services 125,259 121,917
(
3,342
)
-
2.7%
Total ¥ 11,220,303 ¥ 10,986,246 ¥
(
234,057
)
-
2.1%
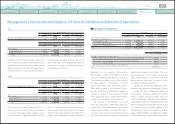
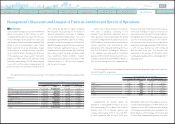
Europe
Thousands of units
Year ended March 31, 2011 vs. 2010 Change
2010 2011 Amount Percentage
Toyota
ʼ
s consolidated vehicle unit sales 858 796
(
62
)
-
7.3%
Yen in millions
Year ended March 31, 2011 vs. 2010 Change
2010 2011 Amount Percentage
Net revenues:
Sales of products ¥2,065,768 ¥ 1,910,336 ¥
(
155,432
)
-
7.5%
Financial services 81,281 71,161
(
10,120
)
-
12.5%
Total ¥2,147,049 ¥ 1,981,497 ¥
(
165,552
)
-
7.7%
North America
Thousands of units
Year ended March 31, 2011 vs. 2010 Change
2010 2011 Amount Percentage
Toyota
ʼ
s consolidated vehicle unit sales 2,098 2,031
(
67
)
-
3.2%
Yen in millions
Year ended March 31, 2011 vs. 2010 Change
2010 2011 Amount Percentage
Net revenues:
Sales of products ¥4,782,379 ¥ 4,603,192 ¥
(
179,187
)
-
3.7%
Financial services 888,147 825,944
(
62,203
)
-
7.0%
Total ¥5,670,526 ¥ 5,429,136 ¥
(
241,390
)
-
4.3%
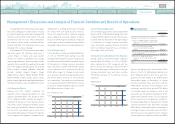
Due to the decline in demand following the
conclusion of subsidies for eco-car offered by the
government as a part of its stimulus packages,
as well as the impact of the Great East Japan
Earthquake, Toyota
ʼ
s domestic vehicle unit sales
decreased by 250 thousand vehicles compared
with the prior fiscal year. The decrease in vehicle
unit sales resulted primarily from a 30 thousand
vehicles, or 31.1%, decrease in Passo sales and
a 29 thousand vehicles, or 38.4%, decrease in
WISH sales. On the other hand, the decrease in
net revenues from domestic vehicle unit sales
was partially offset by the increase in the number
of exported vehicles for the overseas markets of
190 thousand vehicles, or 8.6%.
In North America, the vehicle unit sales of
specified vehicle models increased due to the
recovering trends of the automobile market
and improvements to the overall economy. The
increase in vehicle unit sales and this impact on
sales trends were mainly represented by a 48
thousand vehicles, or 54.5%, increase in Sienna
sales, a 30 thousand vehicles, or 39.2%, increase
in Highlander sales, a 29 thousand vehicles, or
123.7%, increase in 4Runner sales, and a 27
thousand vehicles, or 14.1%, increase in RAV4
sales. Despite the improvements including a
favorable effect of changes in sales mix, net
Although retail sales of Toyota and Lexus brands
ʼ
vehicles increased in some European countries
compared with the prior fiscal year, such as 36
thousand vehicles, or 52.5%, increase in Russia
and 20 thousand vehicles, or 82.6%, increase
in Turkey, net revenues in Europe generally
decreased due primarily to the 62 thousand
revenues decreased compared with the prior
fiscal year due to the decrease in vehicle unit
sales by an intense competitive environment that
introduced new vehicle models to the market and
the unfavorable impact of fluctuations in foreign
currency translation rates of ¥448.0 billion. The
decrease in vehicle unit sales resulted primarily
from an 84 thousand vehicles, or 23.0%, decrease
in Corolla sales and a 28 thousand vehicles, or
7.9%, decrease in Camry sales, partially offset
by the increase in vehicle unit sales of the
aforementioned specified vehicle models.
vehicles decrease in Toyota
ʼ
s vehicle unit sales
compared with the prior fiscal year resulting
from a decrease in demand following the
conclusion of government stimulus packages in
Western Europe, and the unfavorable impact of
fluctuations in foreign currency translation rates
of ¥253.2 billion.
0820
Search NextPrev page 62
Contents