Tiscali 2012 Annual Report Download - page 18
Download and view the complete annual report
Please find page 18 of the 2012 Tiscali annual report below. You can navigate through the pages in the report by either clicking on the pages listed below, or by using the keyword search tool below to find specific information within the annual report.-
 1
1 -
2
-
3
-
4
-
5
-
6
-
7
-
 8
8 -
 9
9 -
 10
10 -
 11
11 -
 12
12 -
 13
13 -
 14
14 -
 15
15 -
 16
16 -
 17
17 -
 18
18 -
 19
19 -
 20
20 -
 21
21 -
 22
22 -
 23
23 -
 24
24 -
 25
25 -
 26
26 -
 27
27 -
 28
28 -
29
-
30
-
31
-
32
-
33
-
34
-
35
-
36
-
37
-
38
-
39
-
40
-
41
-
42
-
43
-
44
-
45
-
46
-
47
-
48
-
49
-
50
-
51
-
52
-
53
-
54
-
55
-
56
-
57
-
58
-
59
-
60
-
61
-
62
-
63
-
64
-
65
-
66
-
67
-
68
-
69
-
70
-
71
-
72
-
73
-
74
-
75
-
76
-
77
-
78
-
79
-
80
-
81
-
82
-
83
-
84
-
85
-
86
-
87
-
88
-
89
-
90
-
91
-
92
-
93
-
94
-
95
-
96
-
97
-
98
-
99
-
100
-
101
-
102
-
103
-
104
-
105
-
106
-
107
-
108
-
109
-
110
-
111
-
112
-
113
-
114
-
115
-
116
-
117
-
118
-
119
-
120
-
121
-
122
-
123
-
124
-
125
-
126
-
127
-
128
-
129
-
130
-
131
-
132
-
133
-
134
-
135
-
136
-
137
-
138
-
139
-
140
-
141
-
142
-
143
-
144
-
145
-
146
-
147
-
148
-
149
-
150
-
151
-
152
-
153
-
154
-
155
-
156
-
157
-
158
-
159
-
160
-
161
-
162
-
163
-
164
-
165
-
166
-
167
-
168
-
169
-
170
-
171
-
172
-
173
-
174
-
175
-
176
-
177
-
178
-
179
-
180
-
181
-
182
-
183
 |
 |

Annual financial report as at 31 December 2012
Date File Name Status Page
-
Annual Report as at 31
December 2012 18
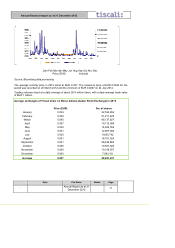
Revenues by business segment
Fig. 3 - Breakdown of revenues by business line and access mode
Source: Tiscali
The chart shows a breakdown by business segment which classifies dual play revenues with Broadband.
Access
The segment in question, which includes revenues from Internet access services via broadband
(ADSL) and narrowband (dial-up), the variable traffic component generated by VoIP services offered
jointly with internet access and mobile telephone services, in 2012 generated revenues of around EUR
174.7 million, down by 11% with respect to the figure in 2011 (EUR 196.2 million).
The decrease in revenues is mainly attributable to the ADSL access services (EUR 101.3 million as at
31 December 2012 compared with EUR 116 million as at 31 December 2011) and the VOIP segment
(EUR 69.7 million as at 31 December 2012 compared with EUR 76.3 million at 31 December 2011).
As at 31 December 2012, ADSL customers came to around 479 thousand of which 344.8 thousand
under direct LLU (Local Loop Unbundling). Direct ADSL customers decreased by around 15 thousand
with respect 31 December 2011.
ADSL customers include around 348 thousand so-called “Dual Play” users (who are provided with
both an internet access service and telephone service on broadband); The customers who use a dial-
up access (narrowband) and analogical voice service stood at around 39 thousand users. The
reduction in the narrowband customer base followed the market trend which saw a progressive
replacement with broadband services in the proposals to customers.