Tiscali 2012 Annual Report Download - page 11
Download and view the complete annual report
Please find page 11 of the 2012 Tiscali annual report below. You can navigate through the pages in the report by either clicking on the pages listed below, or by using the keyword search tool below to find specific information within the annual report.-
 1
1 -
 2
2 -
 3
3 -
 4
4 -
 5
5 -
 6
6 -
 7
7 -
 8
8 -
 9
9 -
 10
10 -
 11
11 -
 12
12 -
 13
13 -
 14
14 -
 15
15 -
 16
16 -
 17
17 -
 18
18 -
 19
19 -
 20
20 -
 21
21 -
 22
22 -
23
-
24
-
25
-
26
-
27
-
28
-
29
-
30
-
31
-
32
-
33
-
34
-
35
-
36
-
37
-
38
-
39
-
40
-
41
-
42
-
43
-
44
-
45
-
46
-
47
-
48
-
49
-
50
-
51
-
52
-
53
-
54
-
55
-
56
-
57
-
58
-
59
-
60
-
61
-
62
-
63
-
64
-
65
-
66
-
67
-
68
-
69
-
70
-
71
-
72
-
73
-
74
-
75
-
76
-
77
-
78
-
79
-
80
-
81
-
82
-
83
-
84
-
85
-
86
-
87
-
88
-
89
-
90
-
91
-
92
-
93
-
94
-
95
-
96
-
97
-
98
-
99
-
100
-
101
-
102
-
103
-
104
-
105
-
106
-
107
-
108
-
109
-
110
-
111
-
112
-
113
-
114
-
115
-
116
-
117
-
118
-
119
-
120
-
121
-
122
-
123
-
124
-
125
-
126
-
127
-
128
-
129
-
130
-
131
-
132
-
133
-
134
-
135
-
136
-
137
-
138
-
139
-
140
-
141
-
142
-
143
-
144
-
145
-
146
-
147
-
148
-
149
-
150
-
151
-
152
-
153
-
154
-
155
-
156
-
157
-
158
-
159
-
160
-
161
-
162
-
163
-
164
-
165
-
166
-
167
-
168
-
169
-
170
-
171
-
172
-
173
-
174
-
175
-
176
-
177
-
178
-
179
-
180
-
181
-
182
-
183
 |
 |

Annual financial report as at 31 December 2012
Date File Name Status Page
-
Annual Report as at 31
December 2012 11
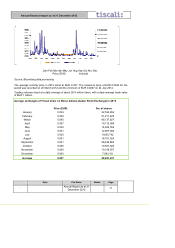
[Jan Feb Mar Apr May Jun Aug Sep Oct Nov Dec
Price (EUR) Volume]
Source: Bloomberg data processing
The average monthly price in 2012 stood at EUR 0.037. The maximum price of EUR 0.0494 for the
period was recorded on 20 March 2012 and the minimum of EUR 0.0267 on 24 July 2012.
Trading volumes stood at a daily average of about 26.9 million items, with a daily average trade value
of EUR 1 million.
Average exchanges of Tiscali share on Borsa Italiana (Italian Stock Exchange) in 2012
Price (EUR) No. of shares
January 0.034 32,534,652
February 0.039 51,211,429
March 0.045 68,137,627
April 0.037 19,712,568
May 0.033 14,925,556
June 0.031 12,807,682
July 0.030 8,655,742
August 0.031 18,751,524
September 0.041 58,436,883
October 0.045 19,581,922
November 0.044 10,318,557
December 0.040 7,983,101
Average 0.037 26,921,437