Thrifty Car Rental 2007 Annual Report Download - page 40
Download and view the complete annual report
Please find page 40 of the 2007 Thrifty Car Rental annual report below. You can navigate through the pages in the report by either clicking on the pages listed below, or by using the keyword search tool below to find specific information within the annual report.-
 1
1 -
2
-
3
-
4
-
5
-
6
-
7
-
8
-
9
-
10
-
11
-
12
-
13
-
14
-
15
-
16
-
17
-
18
-
19
-
20
-
21
-
22
-
23
-
24
-
25
-
26
-
27
-
28
-
29
-
 30
30 -
 31
31 -
 32
32 -
 33
33 -
 34
34 -
 35
35 -
 36
36 -
 37
37 -
 38
38 -
 39
39 -
 40
40 -
 41
41 -
 42
42 -
 43
43 -
 44
44 -
 45
45 -
 46
46 -
 47
47 -
 48
48 -
 49
49 -
 50
50 -
51
-
52
-
53
-
54
-
55
-
56
-
57
-
58
-
59
-
60
-
61
-
62
-
63
-
64
-
65
-
66
-
67
-
68
-
69
-
70
-
71
-
72
-
73
-
74
-
75
-
76
-
77
-
78
-
79
-
80
-
81
-
82
-
83
-
84
-
85
-
86
-
87
-
88
-
89
-
90
-
91
-
92
-
93
-
94
-
95
-
96
-
97
-
98
-
99
-
100
-
101
-
102
-
103
-
104
-
105
-
106
-
107
-
108
-
109
-
110
-
111
-
112
-
113
-
114
 |
 |
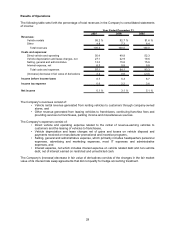
Selling, general and administrative expenses for 2007 decreased $25.3 million. As a percent of revenue,
selling, general and administrative expenses were 13.3% in 2007 compared to 15.6% in 2006.
The decrease in selling, general and administrative expenses in 2007 resulted from the following:
¾ Personnel related expenses decreased $41.5 million due to lower personnel costs of $26.3
million, principally related to IT employees outsourced in October 2006, an $11.0 million decrease
in incentive compensation expense, a $3.5 million decrease in performance share expense and a
$0.7 million reduction in group health insurance. The decrease in performance share expense in
2007 related to a non-recurring 2006 change in estimate for the final calculation of the vested
2003 performance share awards paid in 2006 as well as declining results compared to
performance targets for 2007 compared to 2006.
¾ The market value of investments in the Company’s deferred compensation and retirement plans
decreased $13.9 million, which is offset in other revenue and, therefore, did not impact net
income.
¾ Transition costs relating to the outsourcing of IT and call center operations decreased $2.2
million, including salary related expenses.
¾ Sales and marketing expense decreased $1.4 million due primarily to decreased Internet-related
spending and other marketing related costs.
¾ IT related expenses increased $27.3 million due to the outsourcing of IT services to EDS.
¾ Software expenses increased $3.7 million primarily due to a write off of software made obsolete
by the Pros Fleet Management Software the Company began implementing in the third quarter of
2007.
Net interest expense increased $13.7 million in 2007 primarily due to higher interest rates, higher average
debt, lower cash balances, and a $1.4 million write off of unamortized deferred financing fees related to
the retired revolving credit facility. These increases were partially offset by an increase in interest
reimbursements relating to vehicle programs. As a percent of revenue, net interest expense was 6.3% in
2007 compared to 5.8% in 2006.
The change in fair value of the Company’s interest rate swap agreements was a decrease of $39.0 million
in 2007 compared to a decrease of $9.4 million in 2006 resulting in a year over year decrease of $29.6
million.
The income tax provision for 2007 was $11.6 million. The effective income tax rate was 90.5% for 2007
compared to 41.5% for 2006. The increase in the effective tax rate was due primarily to lower U.S. pretax
earnings in relationship to Canadian pretax losses. The Company reports taxable income for the U.S.
and Canada in separate tax jurisdictions and establishes provisions separately for each jurisdiction. On a
separate, domestic basis, the U.S. effective tax rate approximates the statutory tax rate including the
effect of state income taxes and the impact of establishing valuation allowances for net operating losses
that could expire. However, no income tax benefit was recorded for Canadian losses in 2007 or 2006,
thus, increasing the consolidated effective tax rate compared to the U.S. effective tax rate.
Year Ended December 31, 2006 Compared with Year Ended December 31, 2005
Operating Results
The Company had income before income taxes of $88.4 million for 2006 as compared to $130.5 million in
2005.
32